Fig. C.1.
Download original image
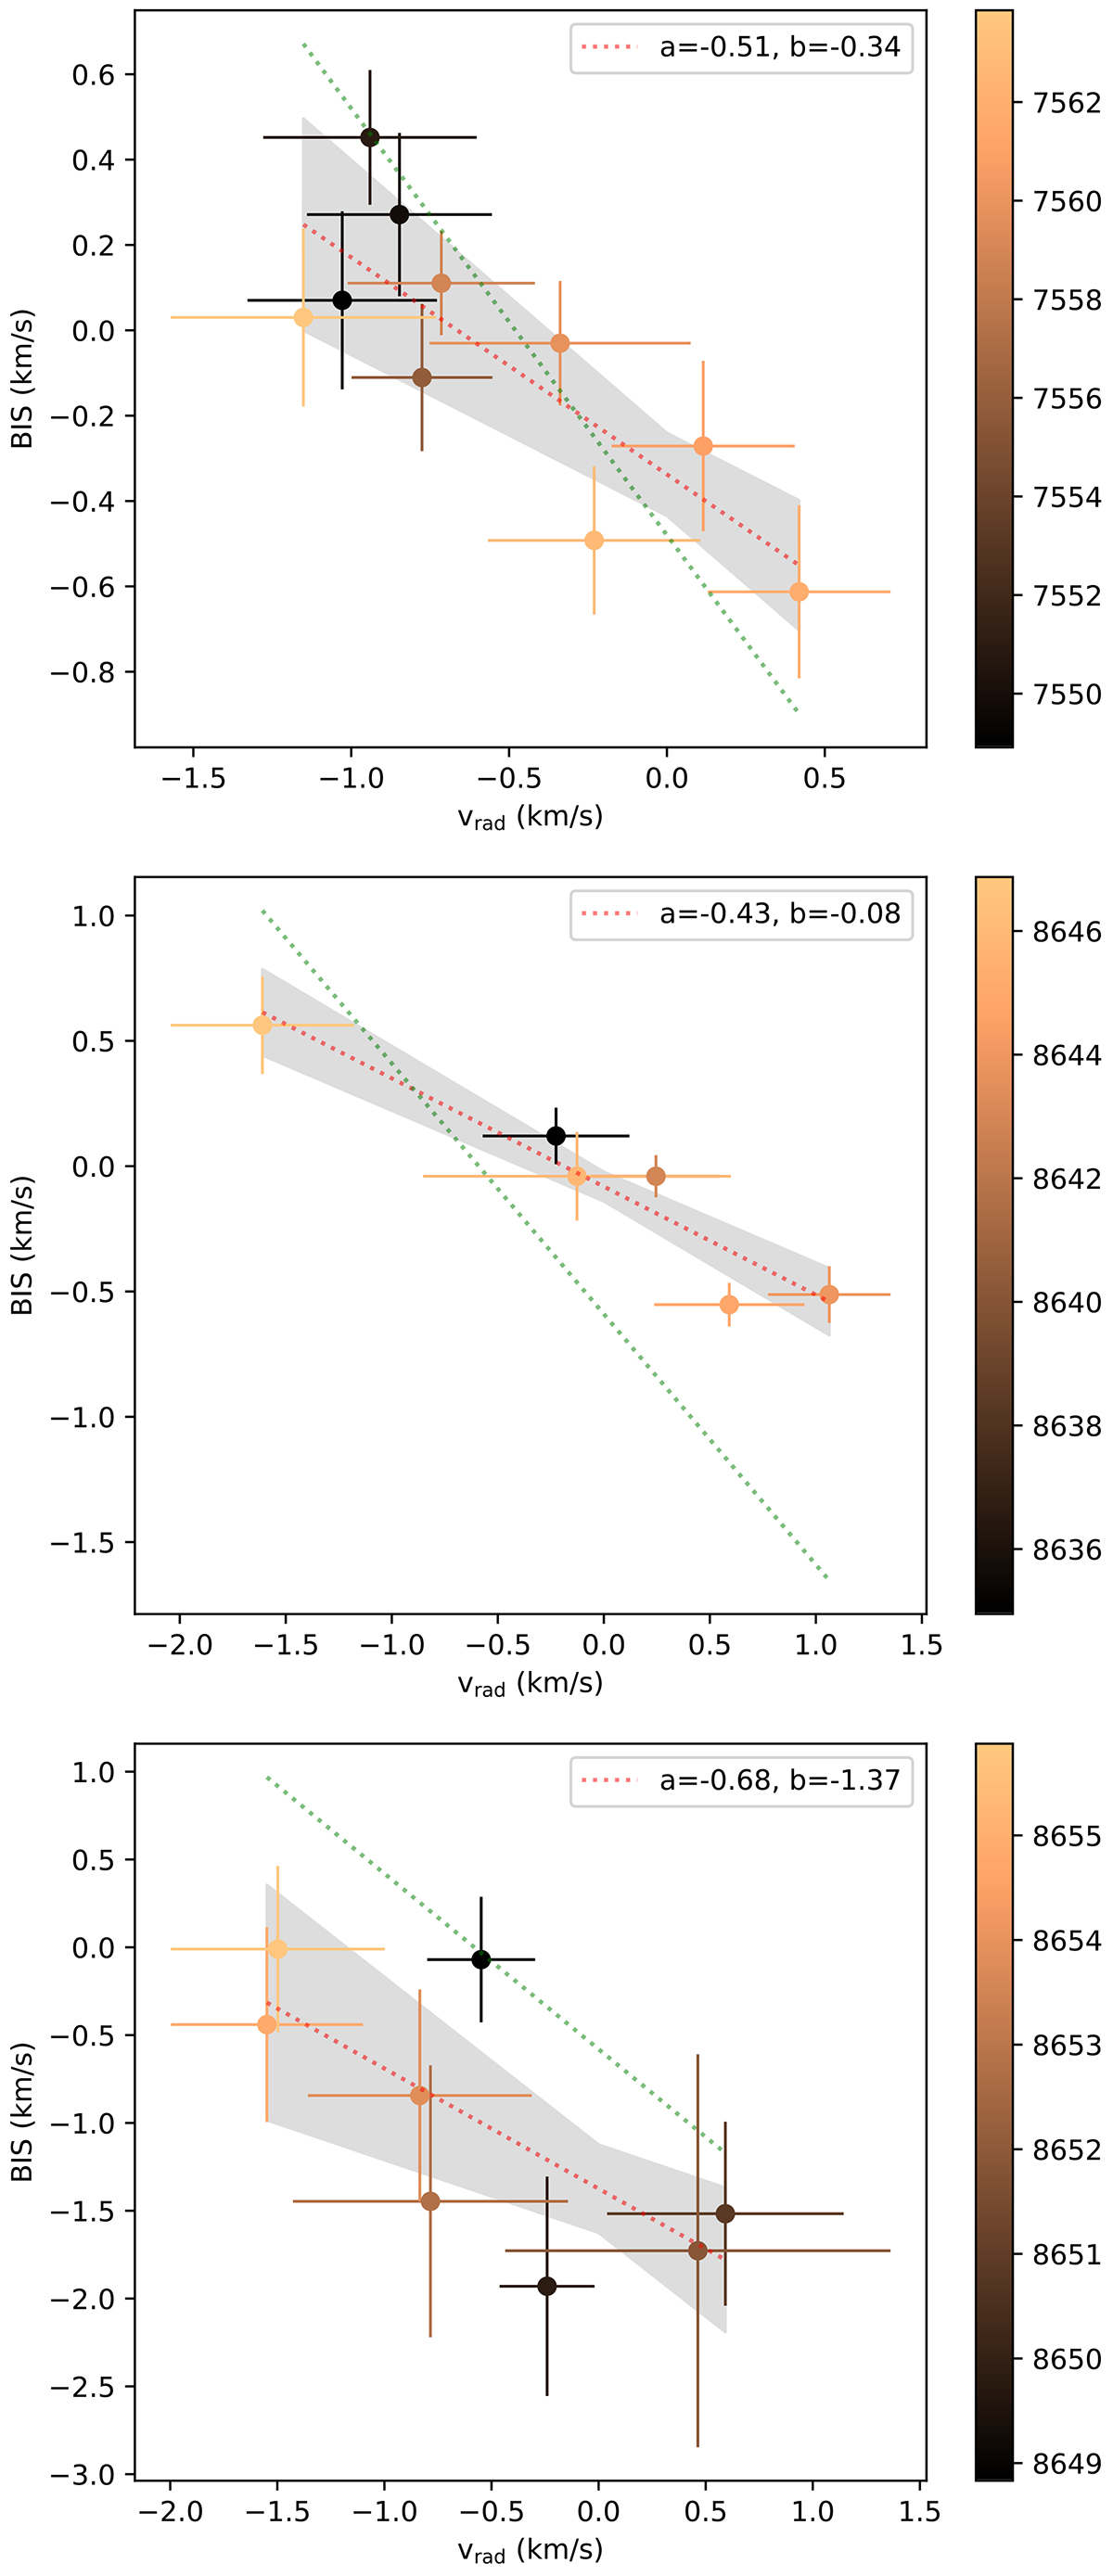
BIS vs RV of ESPaDOnS 2016 (top), 2019 (middle), and SPIRou (bottom) observations. The colour code scales the HJD of observations. The red dotted line shows the best linear regression with slope "a" and intercept "b" indicated in legend. The uncertainty on the regression is shown as the grey-shaded area The green dotted line has a slope of −1 and an intercept equal to the mean radial velocity.
Current usage metrics show cumulative count of Article Views (full-text article views including HTML views, PDF and ePub downloads, according to the available data) and Abstracts Views on Vision4Press platform.
Data correspond to usage on the plateform after 2015. The current usage metrics is available 48-96 hours after online publication and is updated daily on week days.
Initial download of the metrics may take a while.