Open Access
Fig. 2.
Download original image
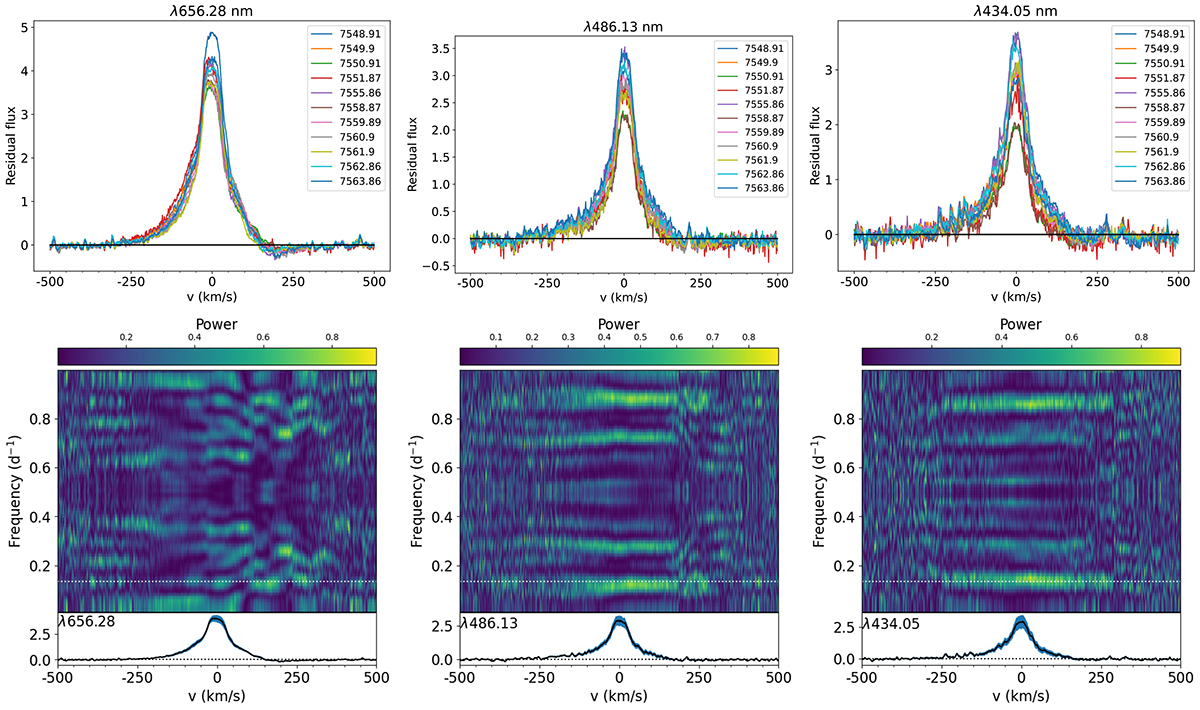
Variability of 2016 Balmer lines of EX Lup. Top row: Hα(left), Hβ(middle), and Hγ(right) residual lines profiles. Each colour represents a different observation. Bottom row: 2D periodograms of the Hα(left), Hβ(middle), and Hγ(right) residual lines. The dotted white line marks the rotation period of 7.417 d.
Current usage metrics show cumulative count of Article Views (full-text article views including HTML views, PDF and ePub downloads, according to the available data) and Abstracts Views on Vision4Press platform.
Data correspond to usage on the plateform after 2015. The current usage metrics is available 48-96 hours after online publication and is updated daily on week days.
Initial download of the metrics may take a while.