Fig. 16.
Download original image
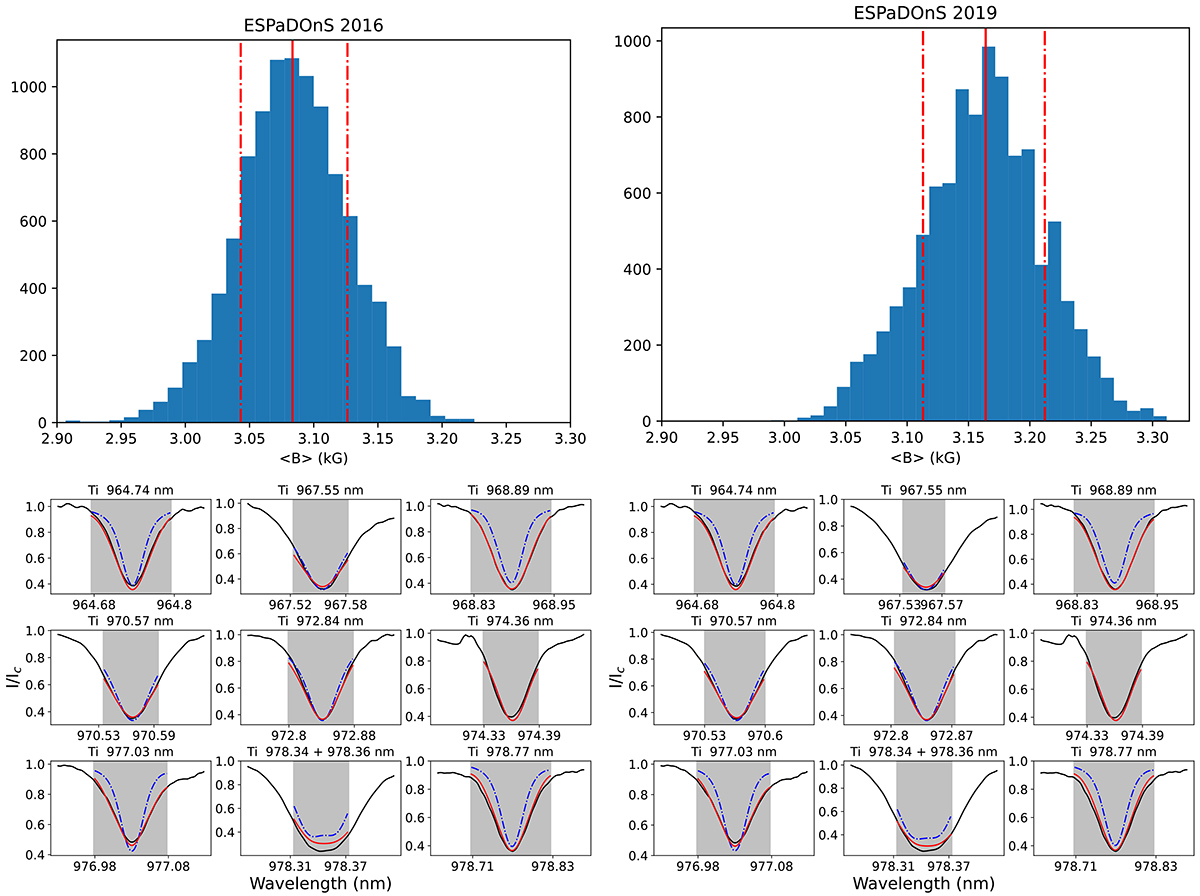
Results of the ESPaDOnS Zeeman intensification analysis. Top: Distribution of the average magnetic field of EX Lup for the 2016 (left) and 2019 (right) data sets. The solid red line represents the median, and the dashed lines represent the 68 % confidence regions. Bottom: Fit to 2016 (left) and 2019 (right) optical Ti I multiplet of EX Lup. The solid red line shows the best fit to the observations in black, while the dashed blue line shows the non-magnetic spectra with otherwise identical stellar parameters. The shaded area marks the region used for the fit.
Current usage metrics show cumulative count of Article Views (full-text article views including HTML views, PDF and ePub downloads, according to the available data) and Abstracts Views on Vision4Press platform.
Data correspond to usage on the plateform after 2015. The current usage metrics is available 48-96 hours after online publication and is updated daily on week days.
Initial download of the metrics may take a while.