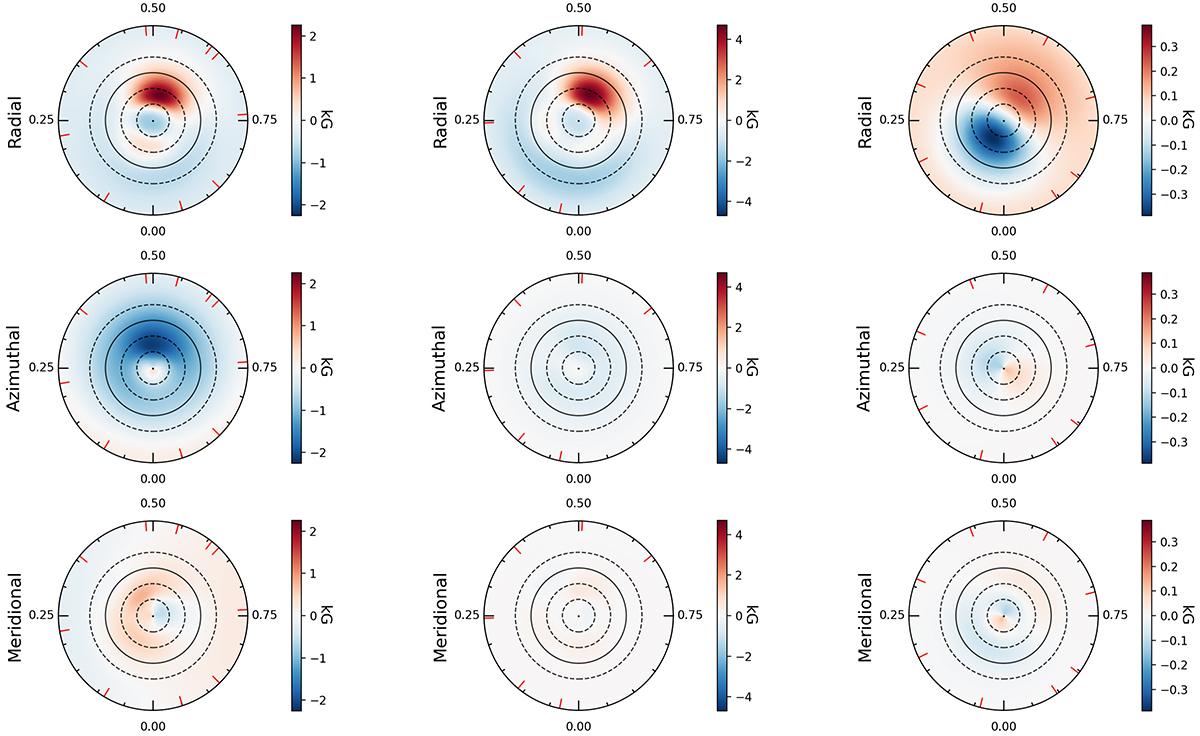
Fig. 15.
Download original image
Radial (top row), azimuthal (middle row), and meridional (bottom row) magnetic maps from the ESPaDOnS 2016, 2019, and SPIRou data sets (left, middle, and right columns, respectively) in the same flattened polar view as Fig. 14. The colour-code scales the magnetic field strength from dark blue for the strongest negative value to dark red for the strongest positive value.
Current usage metrics show cumulative count of Article Views (full-text article views including HTML views, PDF and ePub downloads, according to the available data) and Abstracts Views on Vision4Press platform.
Data correspond to usage on the plateform after 2015. The current usage metrics is available 48-96 hours after online publication and is updated daily on week days.
Initial download of the metrics may take a while.