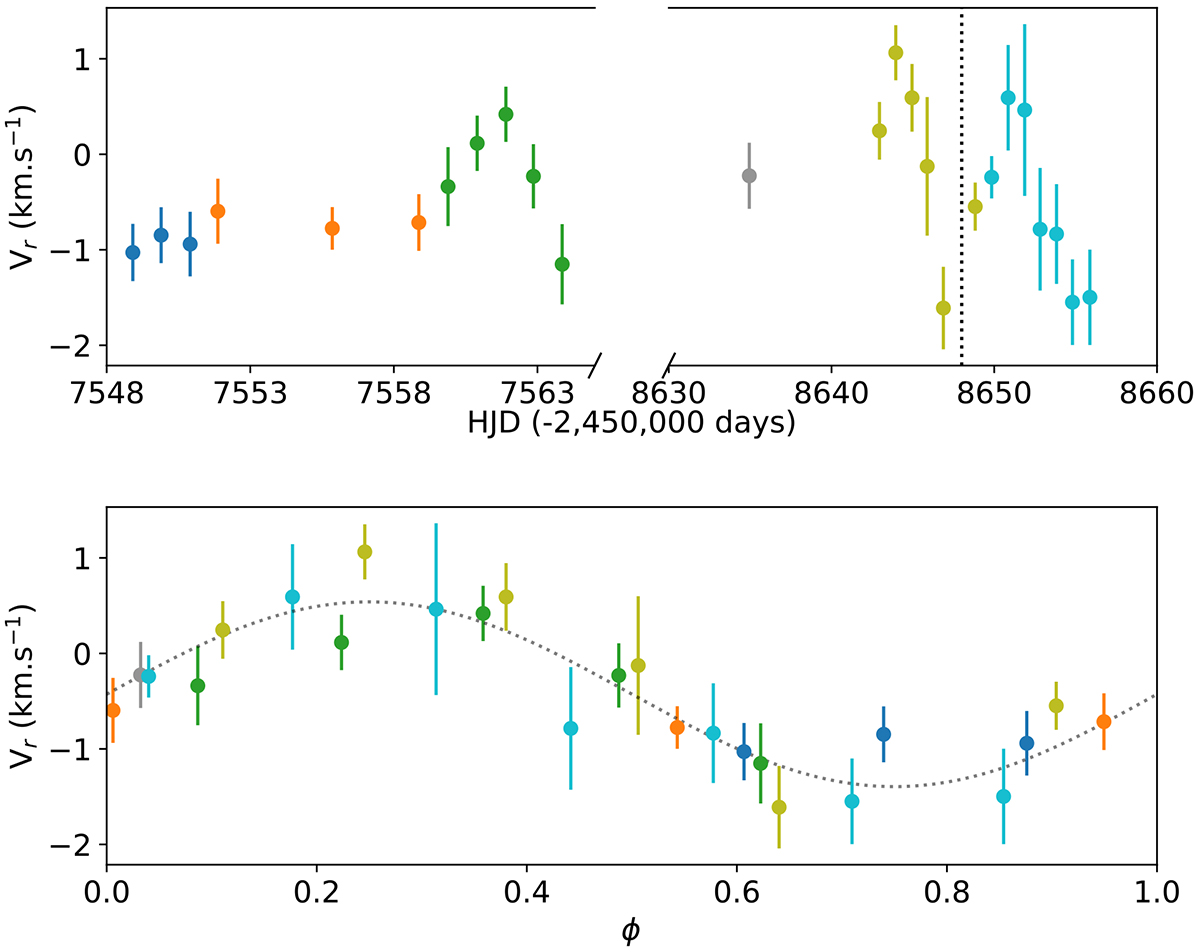
Fig. 1.
Download original image
Radial velocity curves determined for the observation summarised in Table 1. Top: Radial velocity vs. HJD. The vertical dotted line marks the switch from ESPaDOnS to SPIRou, and the different colours represent different rotation cycles. Bottom: Same as above, but folded in phase with P = 7.417 d and T0 = 2 457 544.40981. The dotted curve shows the sinus fit.
Current usage metrics show cumulative count of Article Views (full-text article views including HTML views, PDF and ePub downloads, according to the available data) and Abstracts Views on Vision4Press platform.
Data correspond to usage on the plateform after 2015. The current usage metrics is available 48-96 hours after online publication and is updated daily on week days.
Initial download of the metrics may take a while.