Fig. 5
Download original image
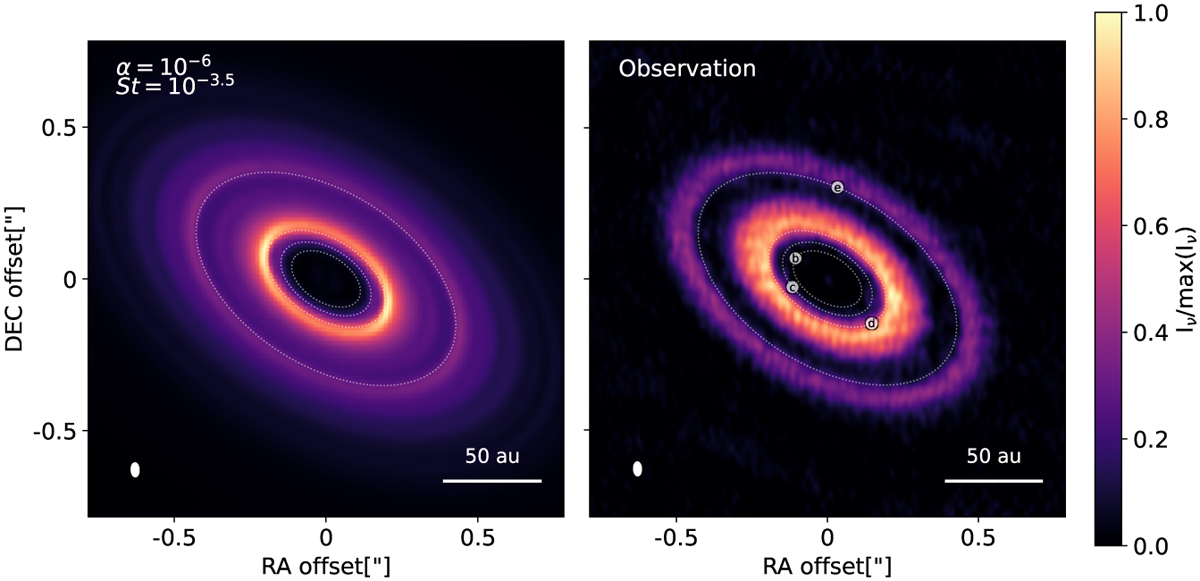
Comparision between the dust continuum in the simulation (left panel) and observation (right panel) for GM Aur disk from Huang et al. (2020), both of them are at 1.3 mm, in ALMA Band 6. The intensities are normalized to the maximum values. We indicated the synthesized beam (lower left corner) and the physical scale of the disk (lower right corner). The simulated dust continuum uses the same dust surface density distribution as in Fig. 4, with the used disk parameters labeled on the top left in the panel. The thin white dashed lines indicate the orbit of the imposed planets in the simulation. We over-plotted the orbits of the hypothesized four planets on top of the observed continuum.
Current usage metrics show cumulative count of Article Views (full-text article views including HTML views, PDF and ePub downloads, according to the available data) and Abstracts Views on Vision4Press platform.
Data correspond to usage on the plateform after 2015. The current usage metrics is available 48-96 hours after online publication and is updated daily on week days.
Initial download of the metrics may take a while.