Fig. 4
Download original image
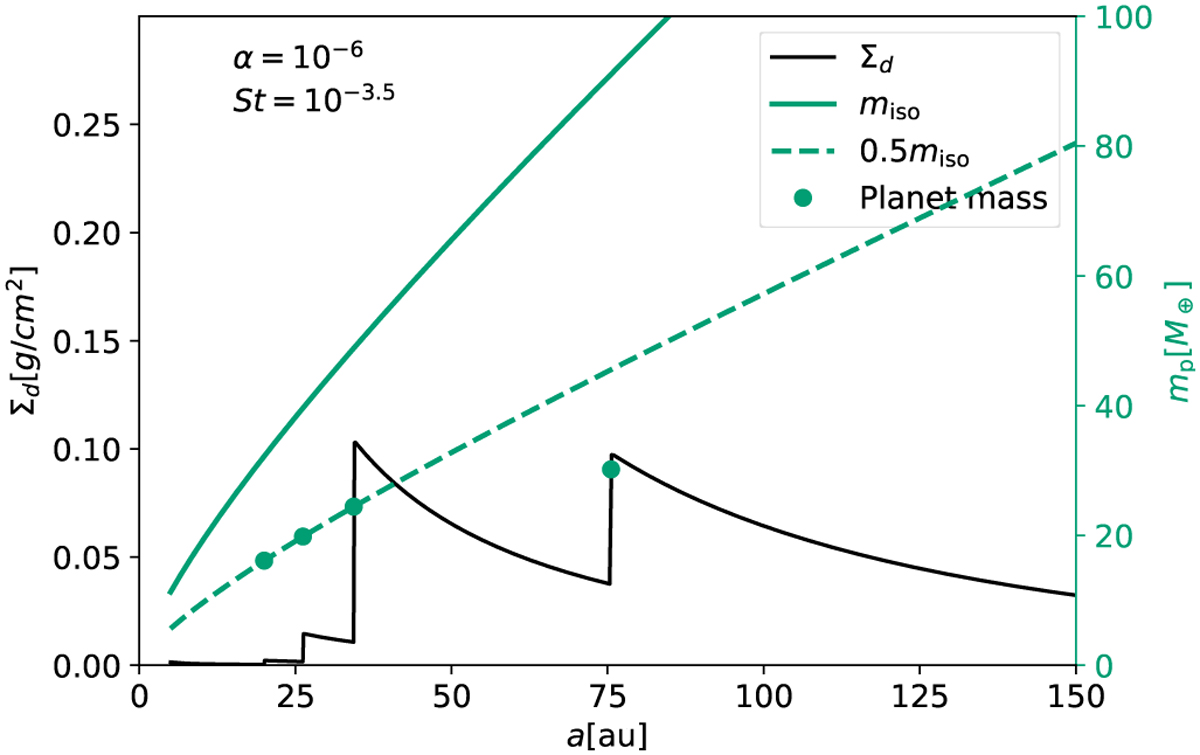
Dust profile and the planet mass in the simulated GM Aur disk. The disk parameters used are labeled on the top left. The solid line is the dust surface density profile and the values are shown on the left y-axis. The black dashed line represents the pebble isolation mass at different locations (x-axis), while the grey dashed line represents half of the pebble isolation mass. Black dots indicate the location and the mass of the planets. The right y-axis shows the values of planet mass.
Current usage metrics show cumulative count of Article Views (full-text article views including HTML views, PDF and ePub downloads, according to the available data) and Abstracts Views on Vision4Press platform.
Data correspond to usage on the plateform after 2015. The current usage metrics is available 48-96 hours after online publication and is updated daily on week days.
Initial download of the metrics may take a while.