Fig. E.1
Download original image
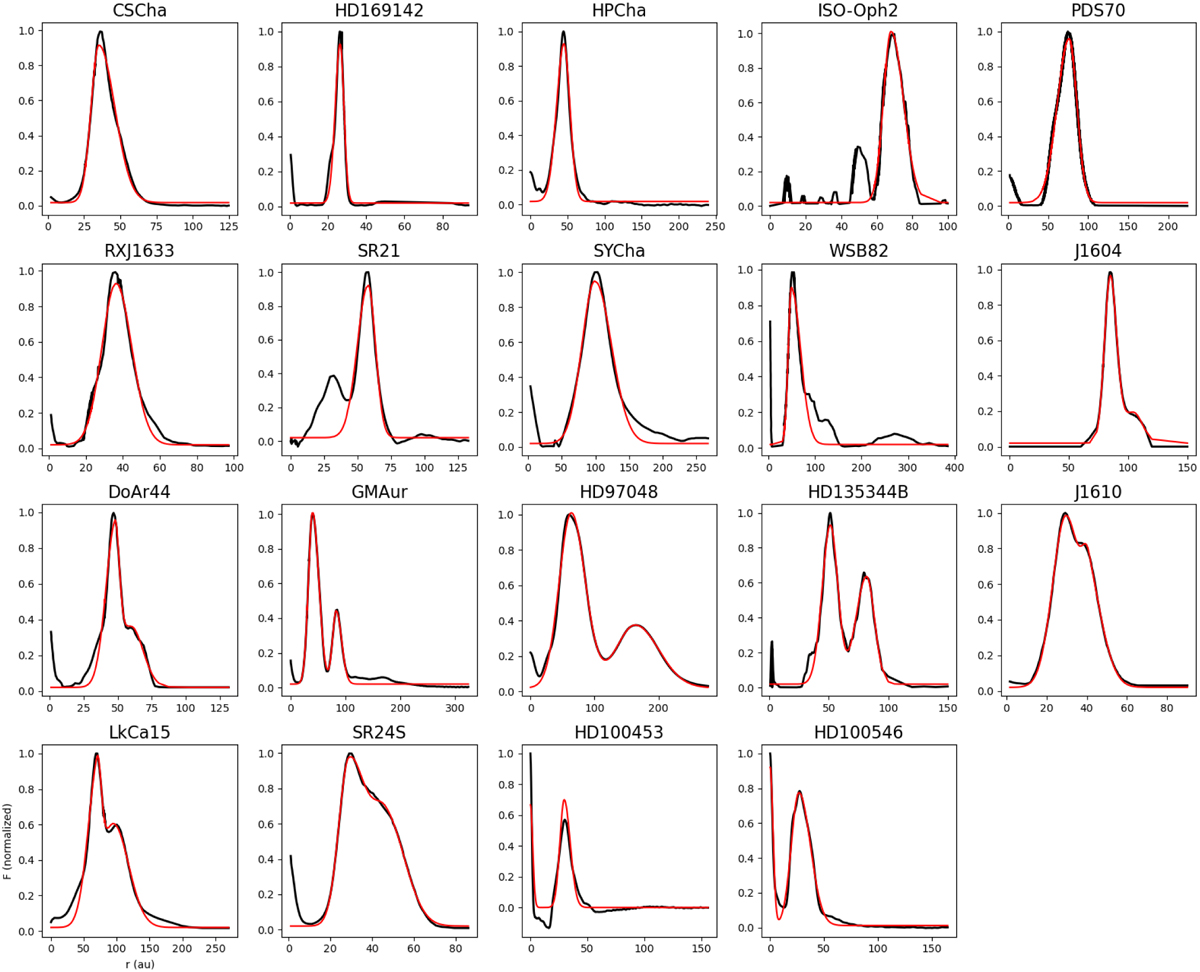
Radial profiles of the selected sample of transition disks. Data are shown in black, best fits in red. The first 9 disks are fit with a single Gaussian, the next two disks with a single Gaussian as well as a central peak, and the final 8 disks with two Gaussians, to match both rings. The best-fit parameters of interest are given in Table E.1.
Current usage metrics show cumulative count of Article Views (full-text article views including HTML views, PDF and ePub downloads, according to the available data) and Abstracts Views on Vision4Press platform.
Data correspond to usage on the plateform after 2015. The current usage metrics is available 48-96 hours after online publication and is updated daily on week days.
Initial download of the metrics may take a while.