Fig. A.1
Download original image
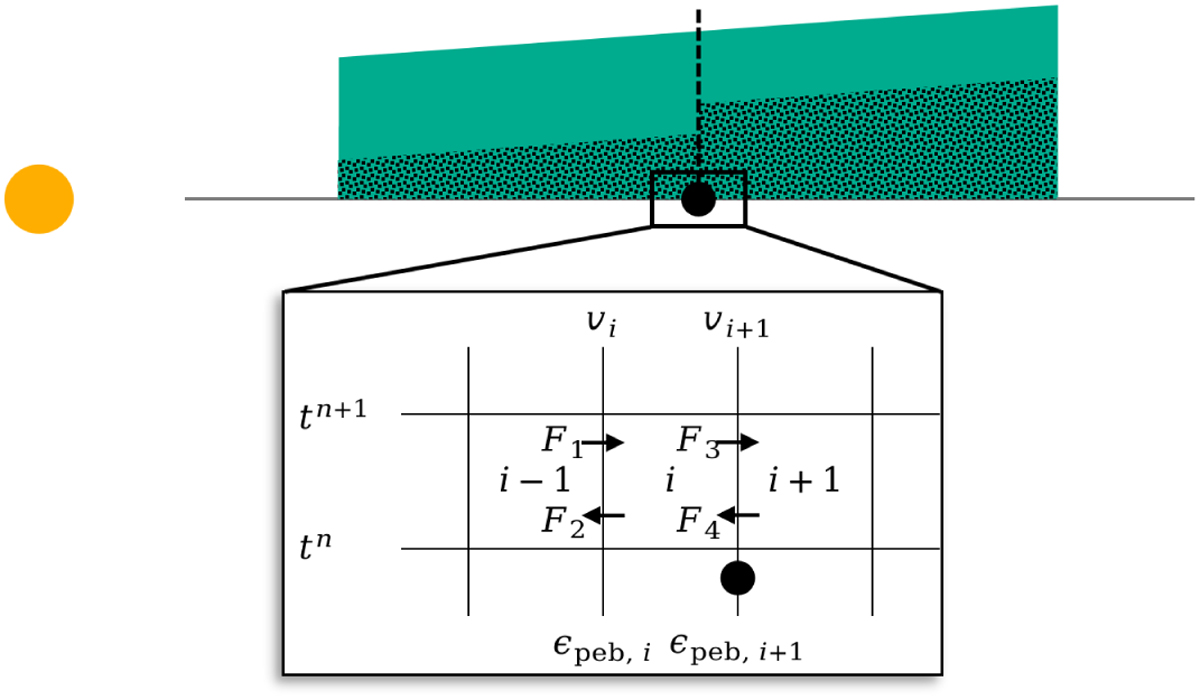
Sketch of the dust transport calculation on the disk grid i, from the time tn to the time tn+1, including pebble accretion. The disk is segmented into N grids. We focus on the region surrounding disk cell i in the zoomed-in view. Arrows depict the direction of various pebble fluxes. The flux going through the planet’s orbit ri is reduced by a factor єpeb,i, which is the planet’s pebble accretion efficiency.
Current usage metrics show cumulative count of Article Views (full-text article views including HTML views, PDF and ePub downloads, according to the available data) and Abstracts Views on Vision4Press platform.
Data correspond to usage on the plateform after 2015. The current usage metrics is available 48-96 hours after online publication and is updated daily on week days.
Initial download of the metrics may take a while.