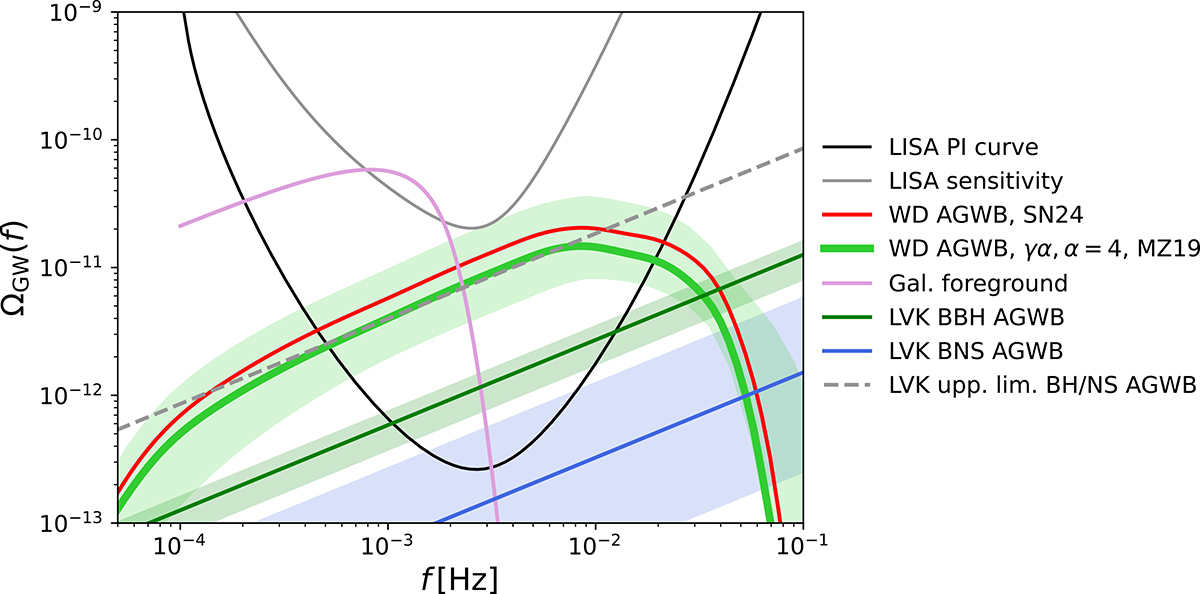
Fig. 8.
Download original image
Same details as in Fig. 4. The red line represents the WD component of the AGWB for a choice of αα, α = 4, with Z = 0.02 and the SFRD of Madau & Dickinson (2014), which is the result from SN24. The light green line represents the WD component of the AGWB for a choice of γα, α = 4 with the MZ19 SFRD model. The light green band represents the uncertainty estimate. The solid grey line shows the normal LISA sensitivity (i.e. not integrated over time and frequency).
Current usage metrics show cumulative count of Article Views (full-text article views including HTML views, PDF and ePub downloads, according to the available data) and Abstracts Views on Vision4Press platform.
Data correspond to usage on the plateform after 2015. The current usage metrics is available 48-96 hours after online publication and is updated daily on week days.
Initial download of the metrics may take a while.