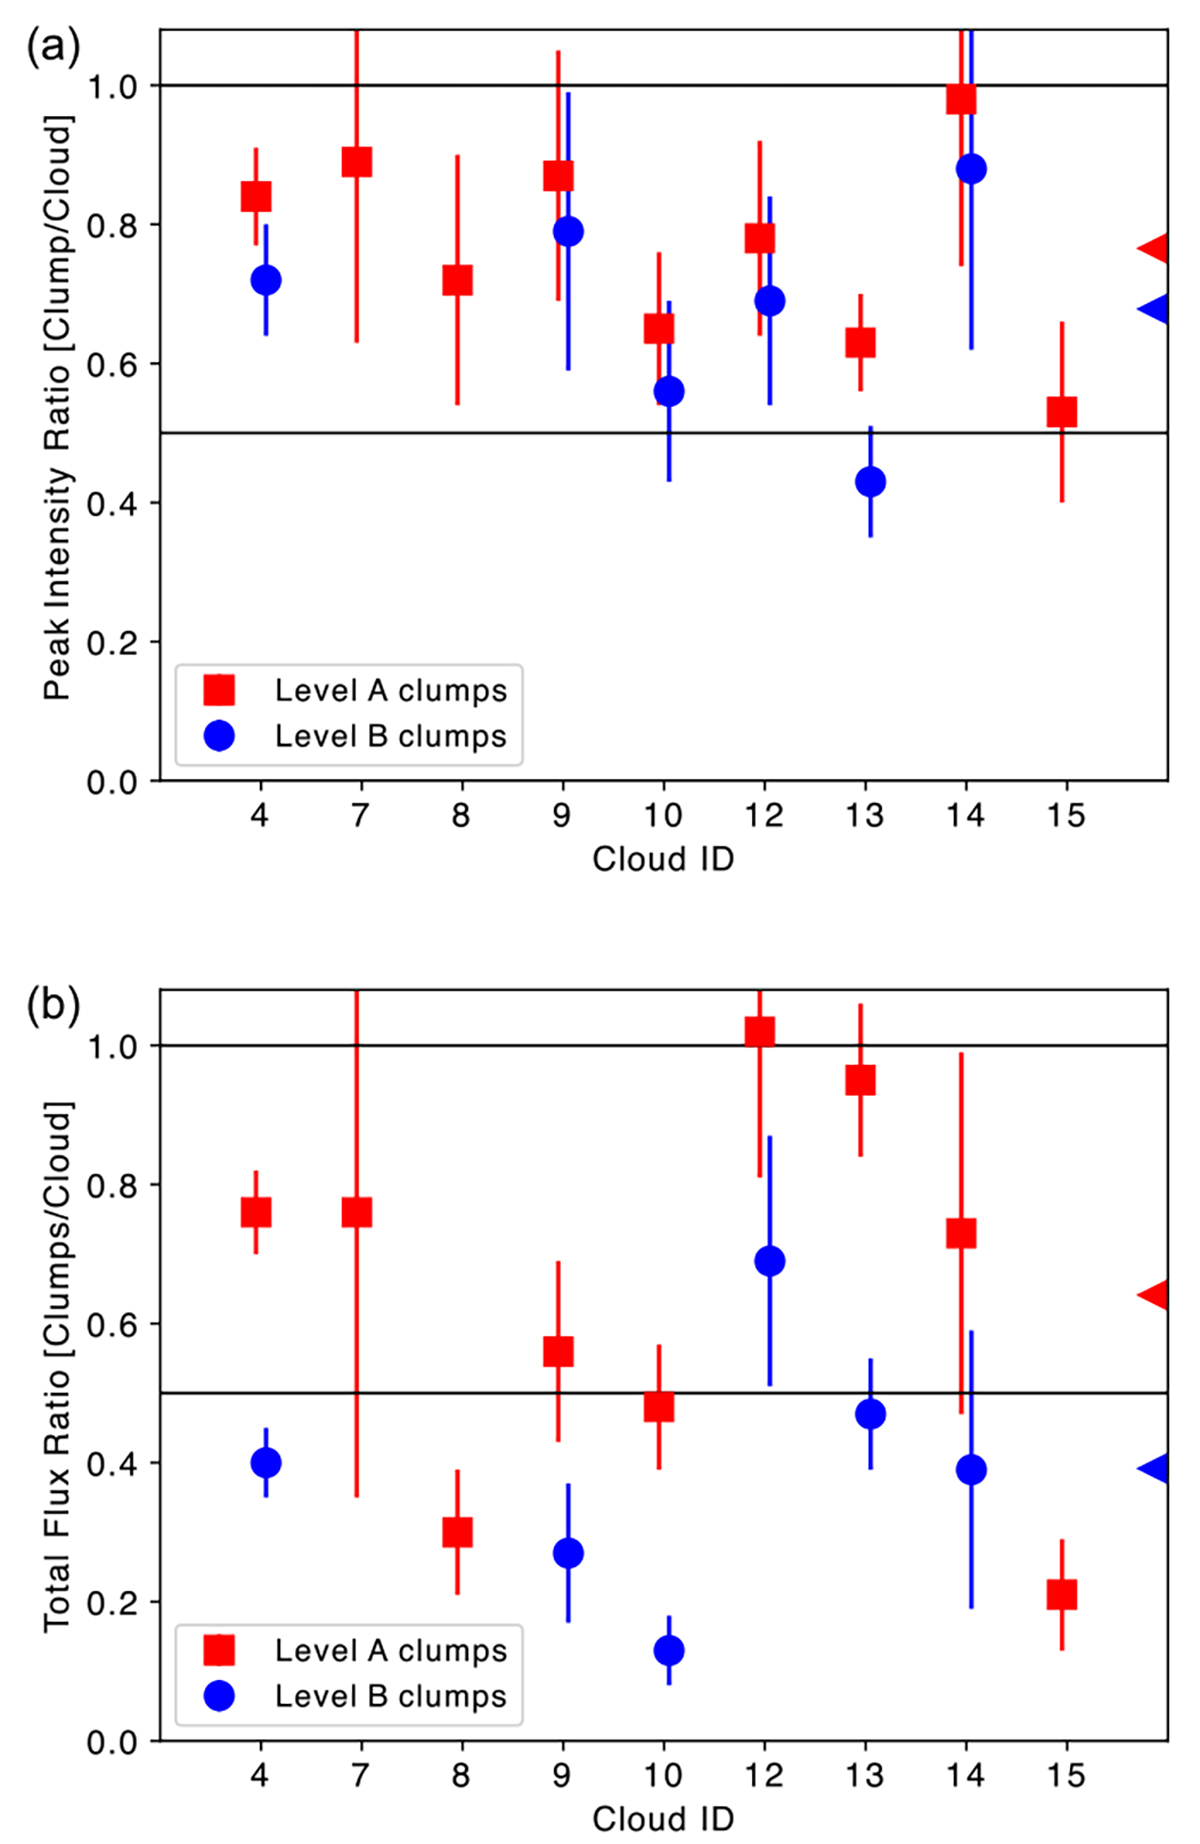
Fig. 4.
Download original image
Clumps over cloud ratios for Level A (red square) and B clumps (blue circle) measured in CO(3–2). (a) Peak intensity ratio. The peak intensity of the brightest clump, max(ℐp) in mJy/beam(1), is compared with the peak intensity of its parental cloud, Ip, in mJy/beam(2). Note that the two beams (1 and 2) have different sizes. (b) Total flux ratio. On the right edge of each panel, the triangles pointing left show the averages of the Level A (red) and B (blue) clumps.
Current usage metrics show cumulative count of Article Views (full-text article views including HTML views, PDF and ePub downloads, according to the available data) and Abstracts Views on Vision4Press platform.
Data correspond to usage on the plateform after 2015. The current usage metrics is available 48-96 hours after online publication and is updated daily on week days.
Initial download of the metrics may take a while.