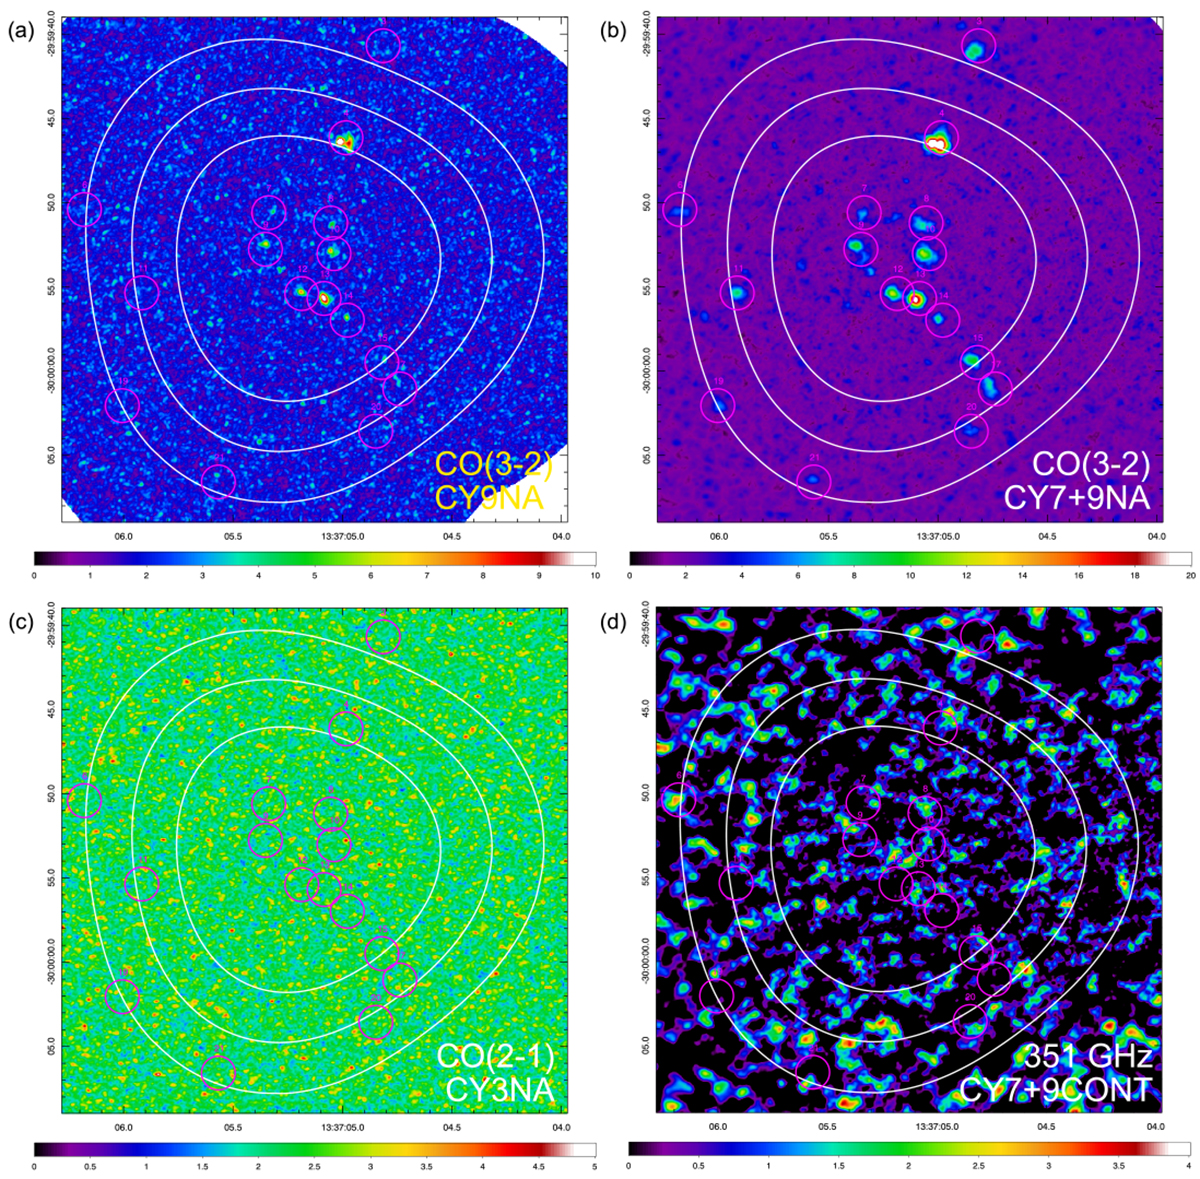
Fig. 3.
Download original image
S/N images in peak intensity: (a) CY9NA – CO(3–2), (b) CY7+9NA – CO(3–2), (c) CY3NA – CO(2–1), and (d) CY7+9CONT – 351 GHz continuum. The white contours show the locations of 70, 50, and 30% the peak sensitivity for the Cy9 data. The magenta circles have diameters of 2″ (44 pc) and mark the locations of the clouds; the cloud IDs are given above each circle.
Current usage metrics show cumulative count of Article Views (full-text article views including HTML views, PDF and ePub downloads, according to the available data) and Abstracts Views on Vision4Press platform.
Data correspond to usage on the plateform after 2015. The current usage metrics is available 48-96 hours after online publication and is updated daily on week days.
Initial download of the metrics may take a while.