Open Access
Fig. 4.
Download original image
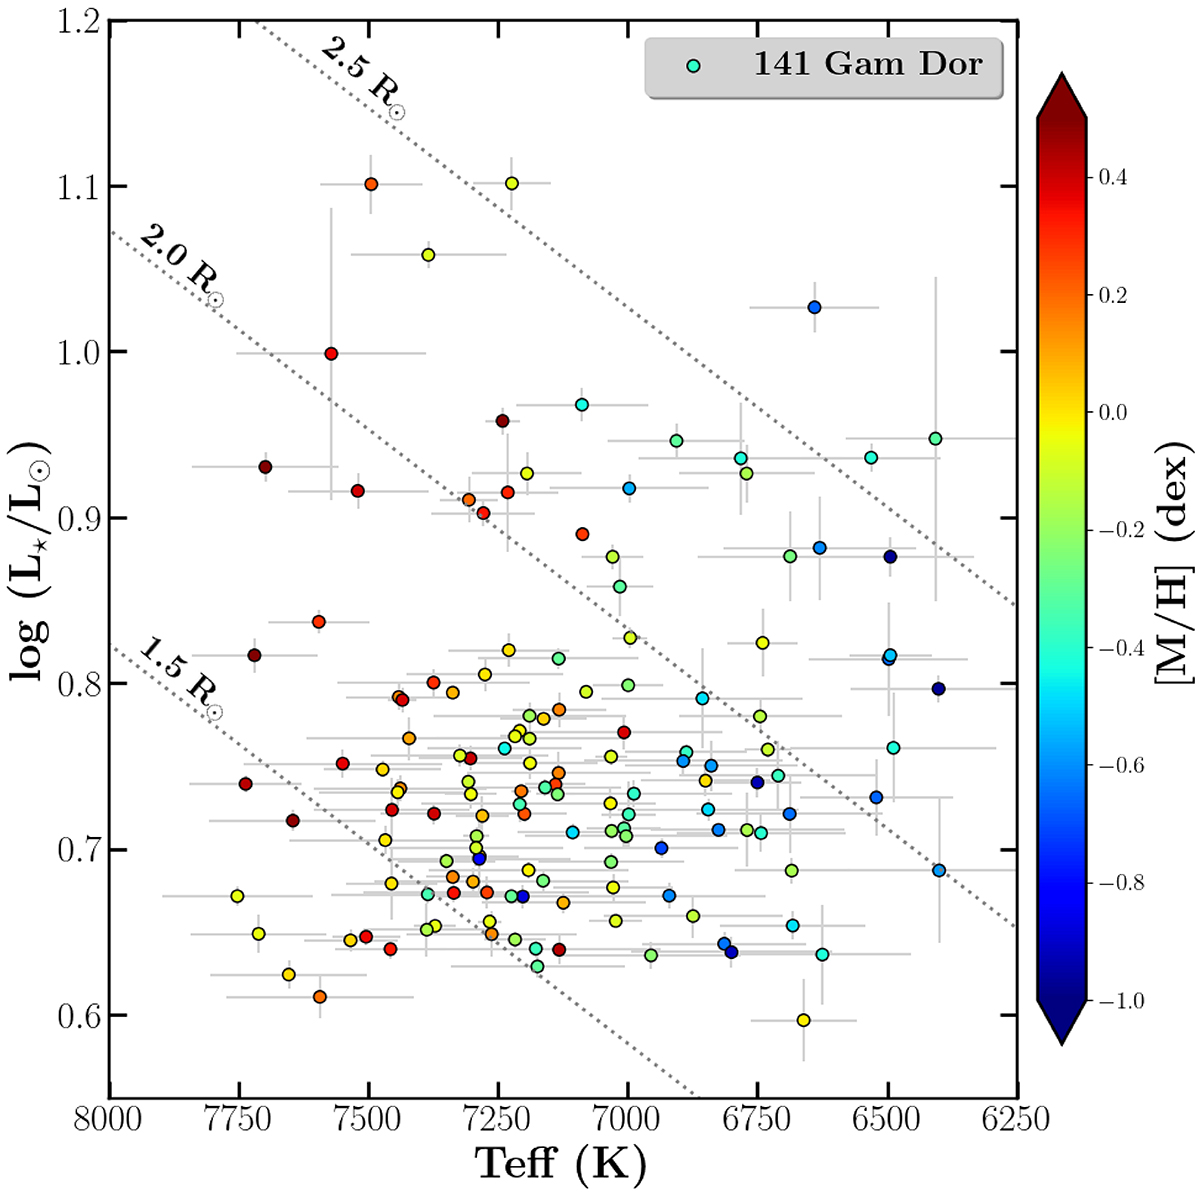
Luminosity versus effective temperature diagram of the HQ sub-sample of γ Dor stars, colour-coded with their global metallicity. Error bars on L⋆ and Teff are shown in light-grey and the dotted lines represent the iso-radius relations.
Current usage metrics show cumulative count of Article Views (full-text article views including HTML views, PDF and ePub downloads, according to the available data) and Abstracts Views on Vision4Press platform.
Data correspond to usage on the plateform after 2015. The current usage metrics is available 48-96 hours after online publication and is updated daily on week days.
Initial download of the metrics may take a while.