Fig. D.1
Download original image
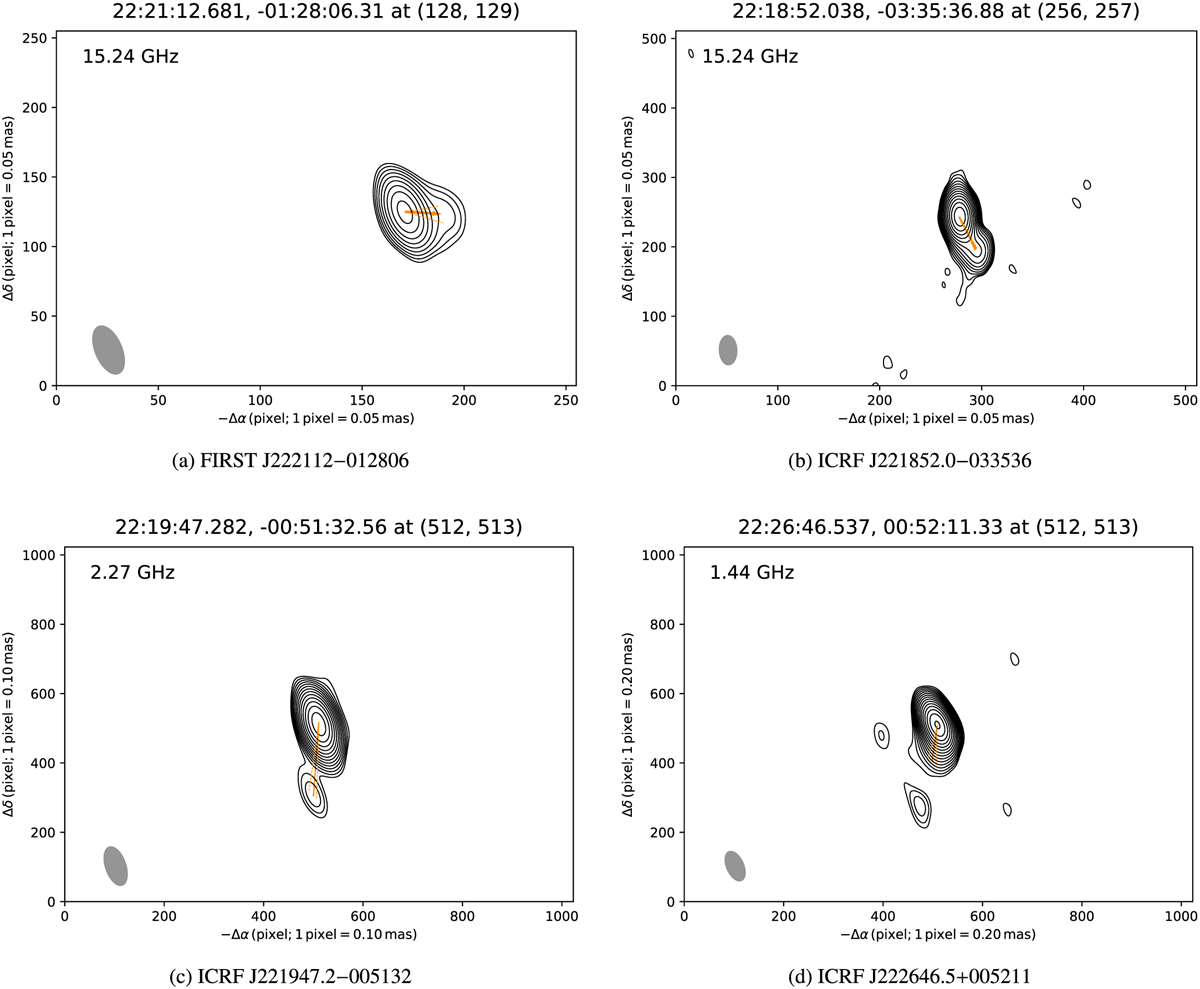
AGN contour plots obtained from the core-shift-determining sessions, and the AGN jet directions determined with arcfits. For the jet direction determinations, image models obtained at higher observing frequencies are preferred, unless extended jet features are not identified by arcfits. The flux density on the m-th (m = 1,2,3,…) contour equals to ![]() , where rms is 0.18 mJy beam−1, 7.3 mJy beam−1, 0.50 mJy beam−1 and 0.65 mJy beam−1 for J2221, J2218, J2219 and J2226, respectively. Δα and Δδ are, respectively, relative right ascension (left to the east) and relative declination in the unit of image pixel. The reference position of each image is provided over the image. In each panel, the gray ellipse shows the size of the synthesized beam; the AGN jet direction is marked with the orange arrow, while the uncertainty of the direction is illustrated with the two dashed lines.
, where rms is 0.18 mJy beam−1, 7.3 mJy beam−1, 0.50 mJy beam−1 and 0.65 mJy beam−1 for J2221, J2218, J2219 and J2226, respectively. Δα and Δδ are, respectively, relative right ascension (left to the east) and relative declination in the unit of image pixel. The reference position of each image is provided over the image. In each panel, the gray ellipse shows the size of the synthesized beam; the AGN jet direction is marked with the orange arrow, while the uncertainty of the direction is illustrated with the two dashed lines.
Current usage metrics show cumulative count of Article Views (full-text article views including HTML views, PDF and ePub downloads, according to the available data) and Abstracts Views on Vision4Press platform.
Data correspond to usage on the plateform after 2015. The current usage metrics is available 48-96 hours after online publication and is updated daily on week days.
Initial download of the metrics may take a while.