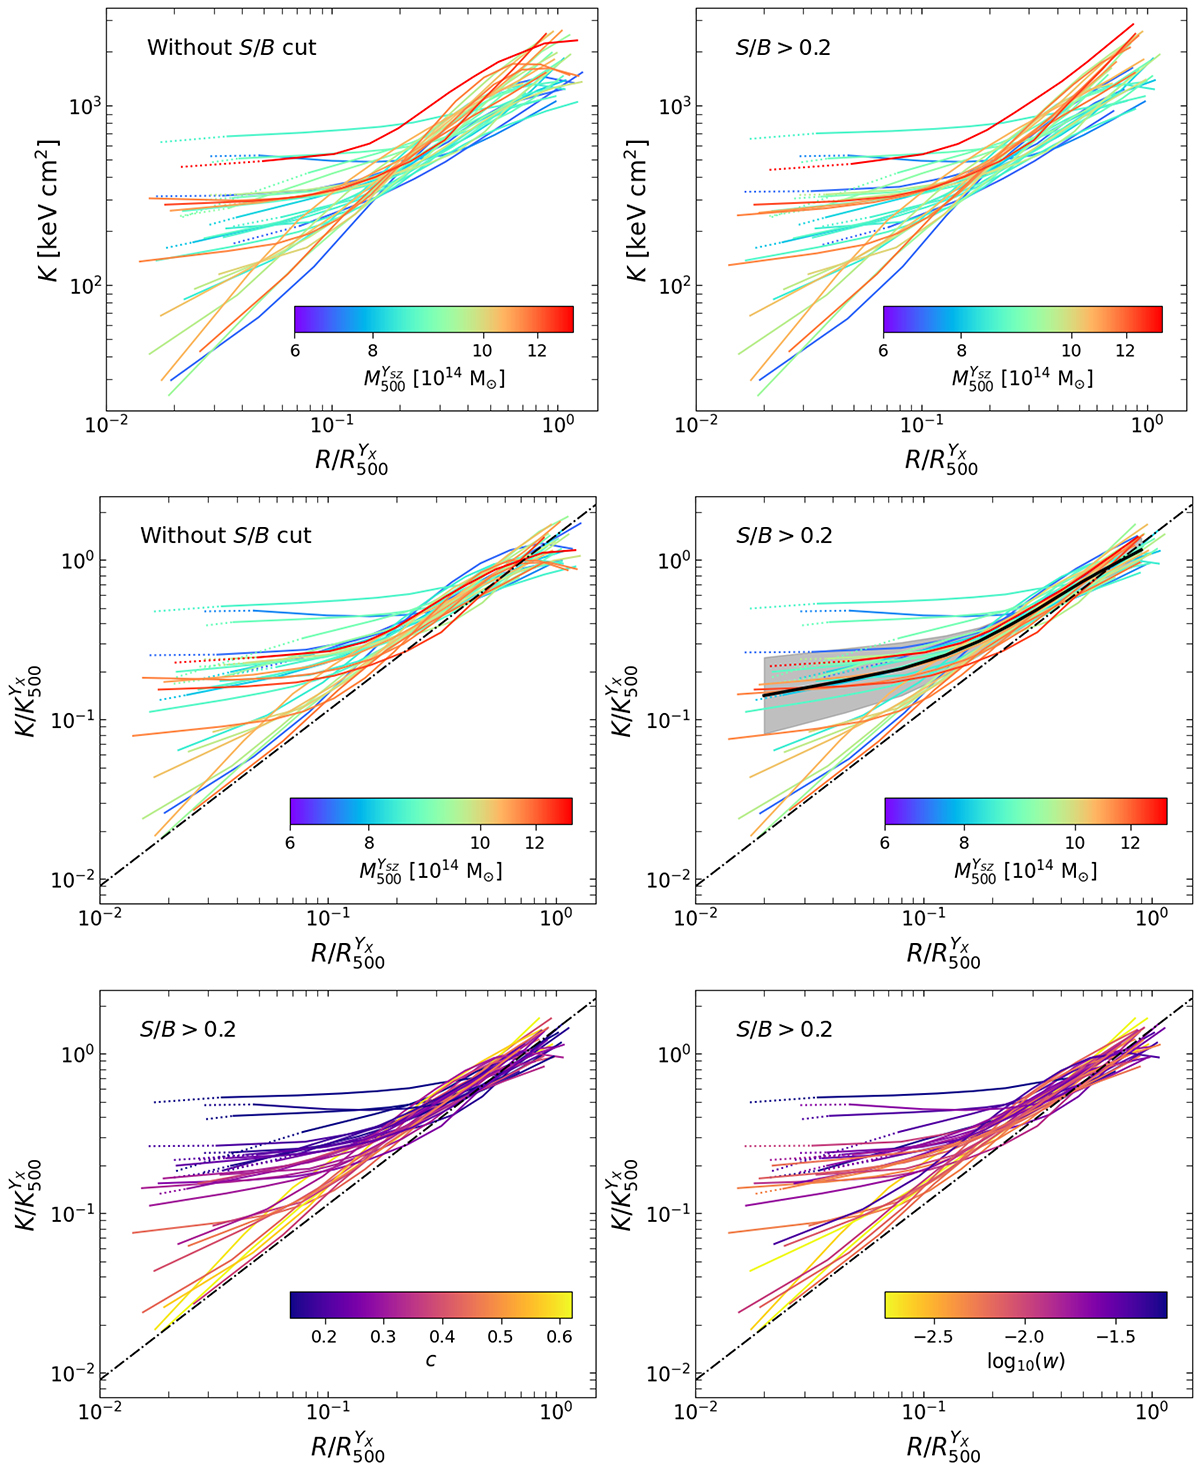
Fig. 4.
Download original image
Entropy profiles of HIGHMz clusters, derived using azimuthal median densities. The profiles are shown in physical units in the upper panels, while they are scaled using K500YX in the centre and bottom. In the upper and central panels, they are colour coded according to the mass, while in the bottom we show the dependence on the concentration (left) and centroid shift (right), as measured by Campitiello et al. (2022). The two labels ‘Without S/B cut’ and ‘S/B > 0.2’ indicate whether all the temperature bins were used in the deprojection or we limited to measurements with S/B > 0.2, respectively. In the central right panel, we also plot the median profile (solid black) and the measured intrinsic dispersion (grey shaded area). At small radii, dotted lines denote profiles derived assuming a constant core temperature on the density radial grid. Black dash-dotted lines in the central and lower panels are predictions from non-radiative simulations (Voit et al. 2005).
Current usage metrics show cumulative count of Article Views (full-text article views including HTML views, PDF and ePub downloads, according to the available data) and Abstracts Views on Vision4Press platform.
Data correspond to usage on the plateform after 2015. The current usage metrics is available 48-96 hours after online publication and is updated daily on week days.
Initial download of the metrics may take a while.