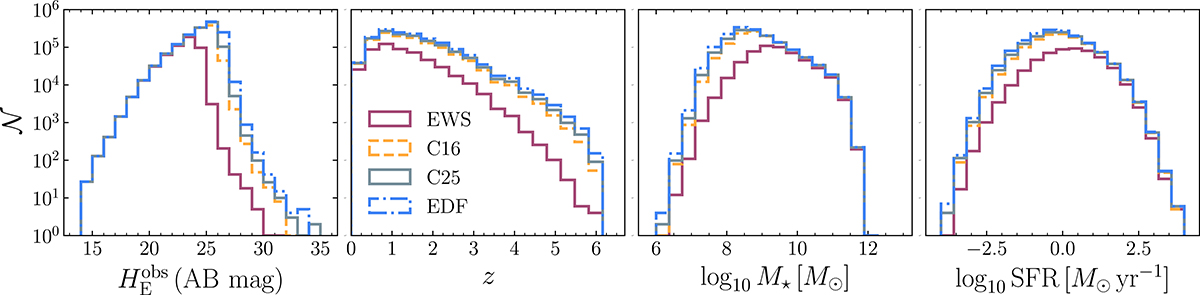
Fig. 2.
Download original image
Four simulated Euclid catalogs used in this work (solid purple line, EWS; dashed orange line, C16; solid gray line, C25; dashed-dotted blue line, EDF) shown as the number of sources as a function of the EuclidHE band magnitude (leftmost panel), redshift (center left), stellar mass (center right), and star formation rate (rightmost panel). We notice that the magnitude cut upon which the fields are built is an OR condition on the S/N in HE, IE filters; as such, simulated galaxies are found below the nominal limiting magnitude cut for HE band, as those are detected at S/N > 10 in IE.
Current usage metrics show cumulative count of Article Views (full-text article views including HTML views, PDF and ePub downloads, according to the available data) and Abstracts Views on Vision4Press platform.
Data correspond to usage on the plateform after 2015. The current usage metrics is available 48-96 hours after online publication and is updated daily on week days.
Initial download of the metrics may take a while.