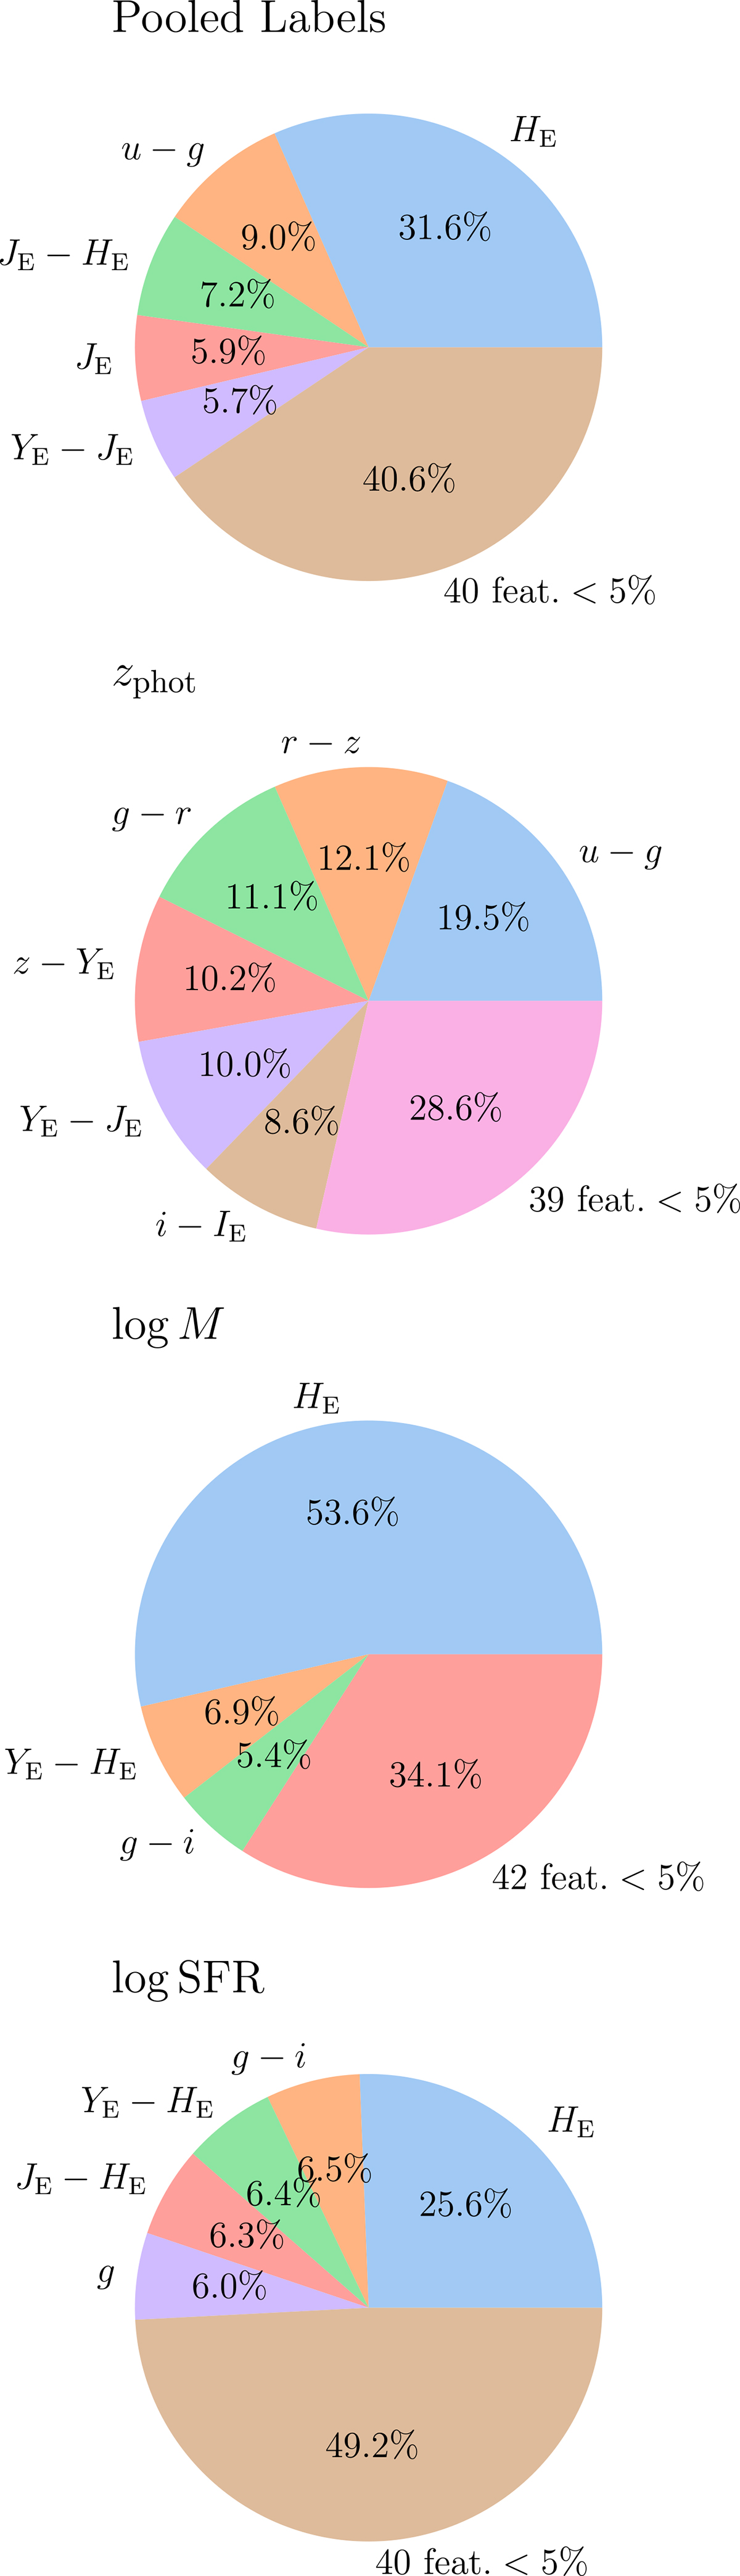
Fig. A.1.
Download original image
Pie chart highlighting the most important features in recovering the pooled labels with CSMR. The feature importance weights (in percentage) how much a single feature influences the final prediction. In the Pooled Labels and log10 SFR only cases, 45 features enter the model (magnitudes and all possible color permutations), only five have an importance over 5%.
Current usage metrics show cumulative count of Article Views (full-text article views including HTML views, PDF and ePub downloads, according to the available data) and Abstracts Views on Vision4Press platform.
Data correspond to usage on the plateform after 2015. The current usage metrics is available 48-96 hours after online publication and is updated daily on week days.
Initial download of the metrics may take a while.