Fig. 19
Download original image
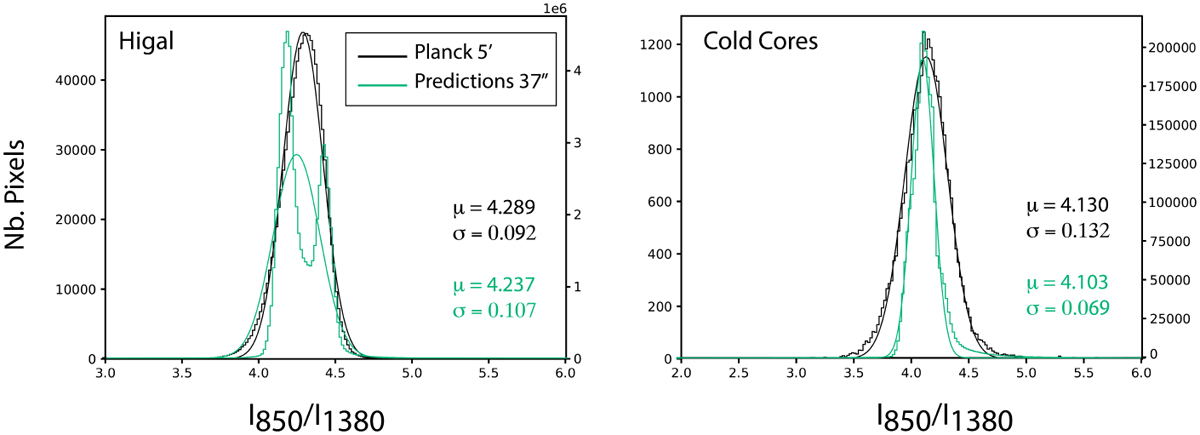
Histograms of the Iν(850)/Iν(1380) ratio for the two Hi-GAL and Cold Cores Herschel large programs, deduced from the Planck data at 5′ in black, and from the predictions at 37″ in green. Gaussian fits are overplotted, with the central values (µ) and the standard deviations (σ) given in each panel. The left and right y axes in each panel correspond to the number of pixels for the Planck data and prediction histograms. See Fig. A.4 for histograms of all the Herschel large programs described in Sect. 2.2.
Current usage metrics show cumulative count of Article Views (full-text article views including HTML views, PDF and ePub downloads, according to the available data) and Abstracts Views on Vision4Press platform.
Data correspond to usage on the plateform after 2015. The current usage metrics is available 48-96 hours after online publication and is updated daily on week days.
Initial download of the metrics may take a while.