Fig. 4.
Download original image
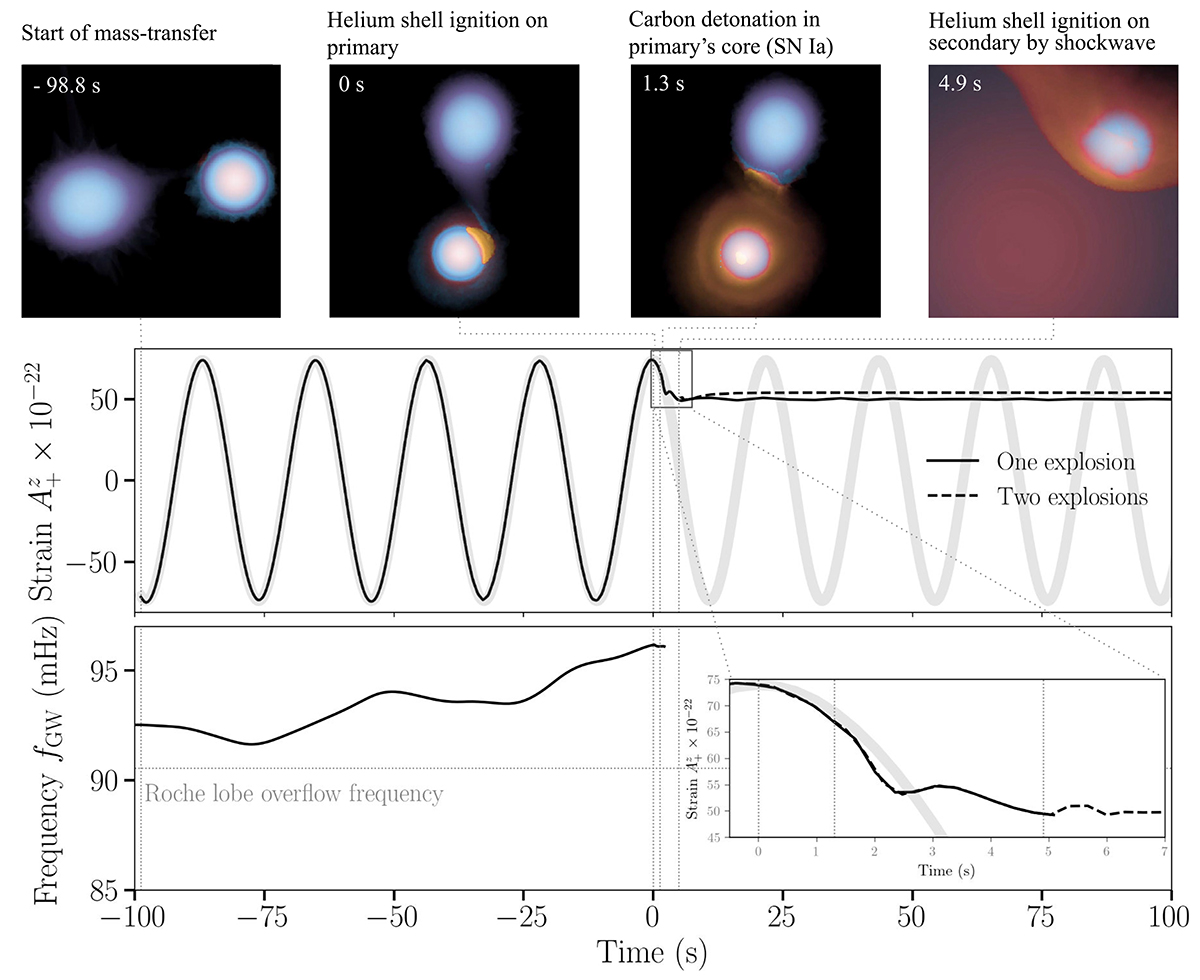
GW frequency and strain as a function of time derived from the 3D hydrodynamical simulation of the 1.05 M⊙ and 0.7 M⊙ carbon-oxygen white dwarf binary in Pakmor et al. (2022), in which the primary undergoes double detonation. Top panels: Key steps of the double-detonation mechanism. t = −98.8 s is the onset of the mass transfer from the secondary (the visibly larger, fluffier white dwarf) onto the primary (the more compact of the two). t = 0 s is the helium-shell ignition on the primary. At t = 1.3 s the helium detonation wraps around the primary, triggering the detonation of the primary’s carbon-oxygen core. At t = 4.9 s, the carbon detonation completely burns the primary (resulting in a SN Ia) and triggers helium-shell ignition on the secondary. Middle panel: Evolution of GW strain. The A+z GW polarisation amplitude is computed based on the output of the hydrodynamical simulation following the Morán-Fraile et al. (2023) method and assuming a distance of 8.2 kpc. The solid black line shows the ‘one-explosion’ model, in which only the primary undergoes double detonation; the dashed line represents the ‘two-explosion’ model, in which the explosion of the primary also triggers a double detonation of the secondary. In both cases, after the SN Ia explosion, the amplitude levels off at a constant value until the end of the simulation, which represents the homogeneous expansion of the supernova ejecta. For comparison, the thick grey-shaded line represents a monochromatic signal of 92 Hz frequency and of equivalent amplitude. The inset shows a zoomed-in view between –0.5 s and 7 s. Bottom panel: Evolution of the GW frequency (solid line) that we computed directly from the binary separation obtained from the hydrodynamical simulation.
Current usage metrics show cumulative count of Article Views (full-text article views including HTML views, PDF and ePub downloads, according to the available data) and Abstracts Views on Vision4Press platform.
Data correspond to usage on the plateform after 2015. The current usage metrics is available 48-96 hours after online publication and is updated daily on week days.
Initial download of the metrics may take a while.