Fig. 7
Download original image
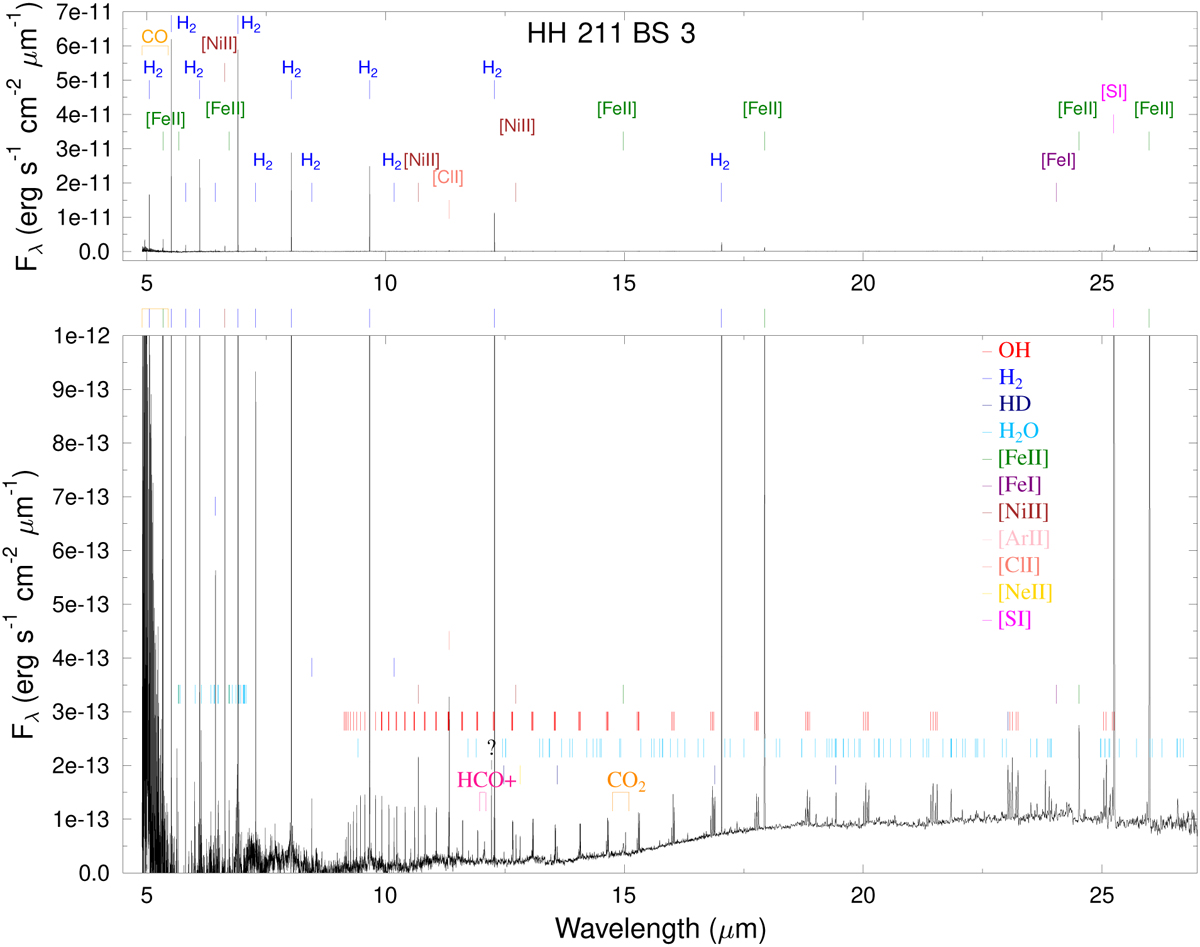
Spectrum of HH211 BS3 (see Fig. 1) extracted at RA(J2000): 03h43m59s.413, Dec(J2000): +32°00′35″.27. The top panel shows the Ml flux-density range of the spectrum (up to 7 × 10- erg s−11 cm−2 µm−1), and the bottom panel shows a close-up (up to 10−12 erg s−1 cm−2 µm−1). Detected lines are labelled. Different colours indicate different species.
Current usage metrics show cumulative count of Article Views (full-text article views including HTML views, PDF and ePub downloads, according to the available data) and Abstracts Views on Vision4Press platform.
Data correspond to usage on the plateform after 2015. The current usage metrics is available 48-96 hours after online publication and is updated daily on week days.
Initial download of the metrics may take a while.