Fig. 3
Download original image
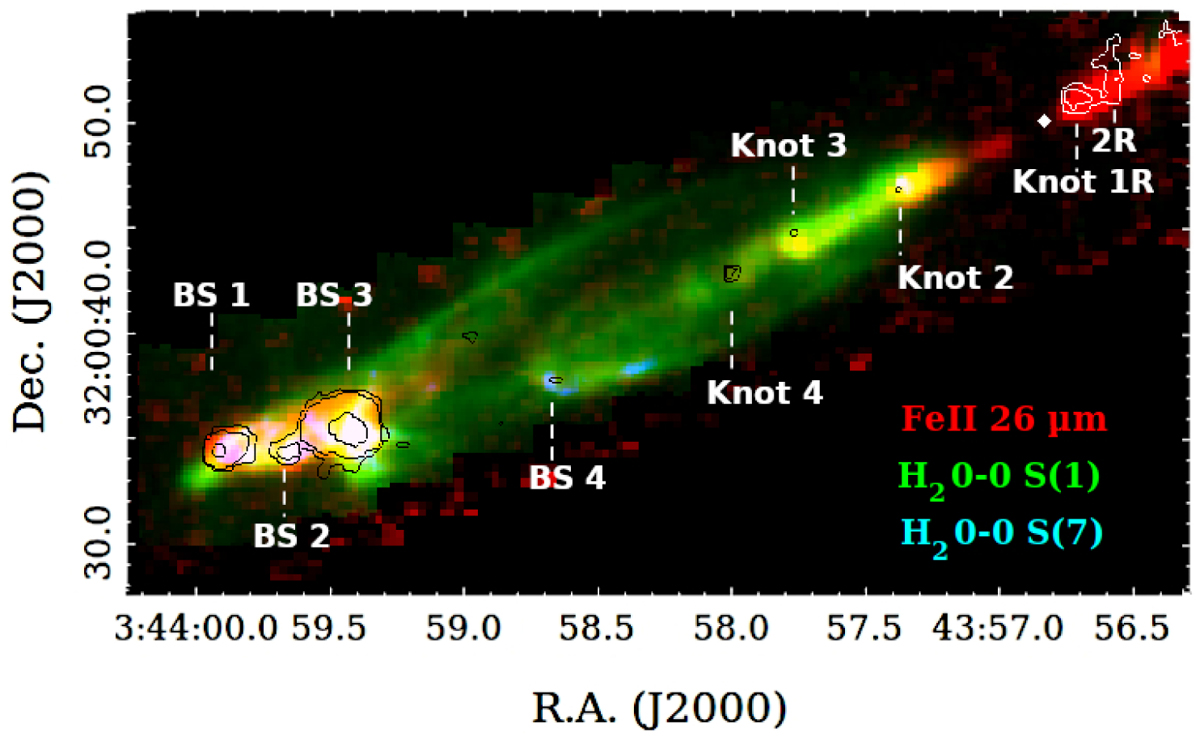
Tricolour MIRI-MRS map of H2 0-0 S(7) (at 5.5 µm, in blue), H2 0-0 S(1) (at 17 µm, in green), and [Fe II] (at 26 µm, in red) emission lines. The white circle marks the position of the ALMA mm continuum source. Black and white contours indicate the position (on the blue- and redshifted lobe side, respectively) of continuum emission integrated between 25.3 and 25.9 µm (displayed contours are at 3, 5, and 50 σ; 1σ=4 MJy sr−1). Knots and bow shocks showing continuum emission are indicated.
Current usage metrics show cumulative count of Article Views (full-text article views including HTML views, PDF and ePub downloads, according to the available data) and Abstracts Views on Vision4Press platform.
Data correspond to usage on the plateform after 2015. The current usage metrics is available 48-96 hours after online publication and is updated daily on week days.
Initial download of the metrics may take a while.