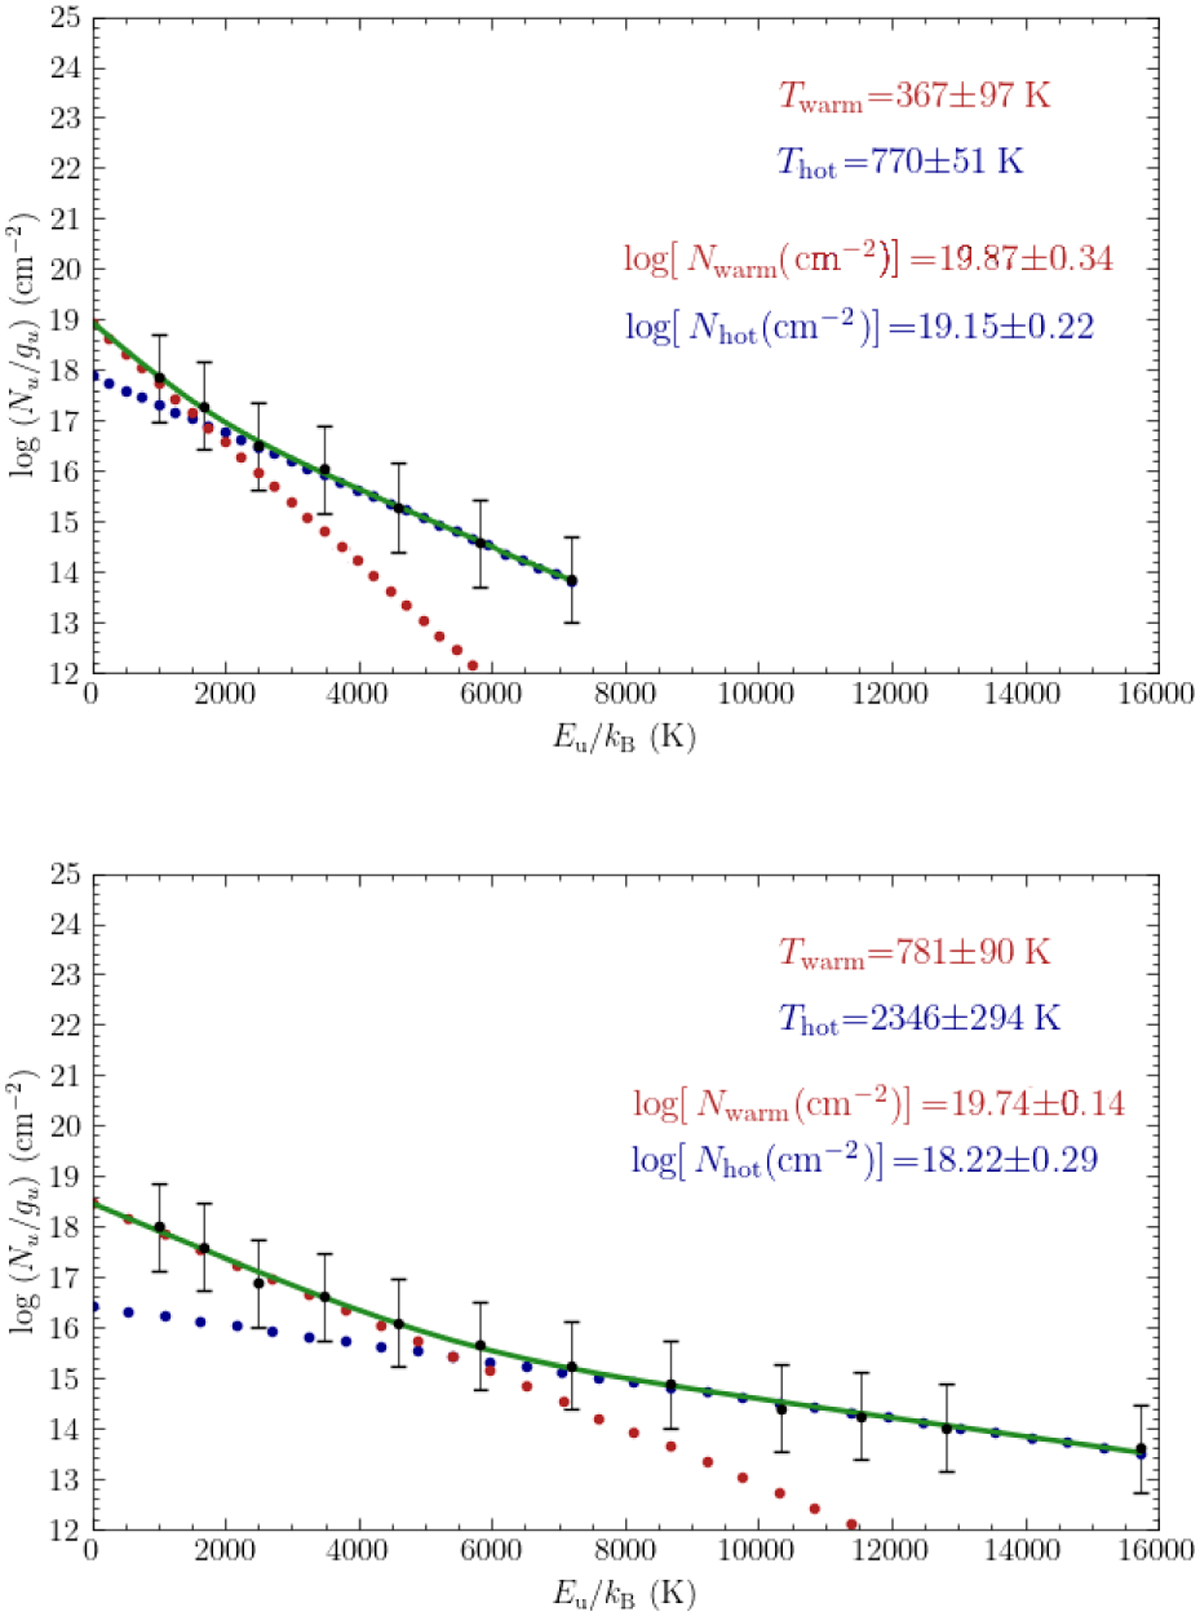
Fig. B.2
Download original image
Examples of pixel-by-pixel ro-vibrational diagram towards HH211. Top panel: ro-vibrational diagram in the blueshifted inner jet (R.A.(J2000): 03h43m57.469, Dec.(J2000): +32°00′47.″33), where only v = 0 lines (up to S(7)) are detected. In this case, temperature of both components is low and column density is high. Bottom panel: ro-vibrational diagram towards the wing of BS 3 (R.A.(J2000): 03h43m59.s 277, Dec.(J2000): +32°00′35.″13), where both v = 0 and v = 1 lines are detected. In this case, the temperature of both components is high and the column density is low.
Current usage metrics show cumulative count of Article Views (full-text article views including HTML views, PDF and ePub downloads, according to the available data) and Abstracts Views on Vision4Press platform.
Data correspond to usage on the plateform after 2015. The current usage metrics is available 48-96 hours after online publication and is updated daily on week days.
Initial download of the metrics may take a while.