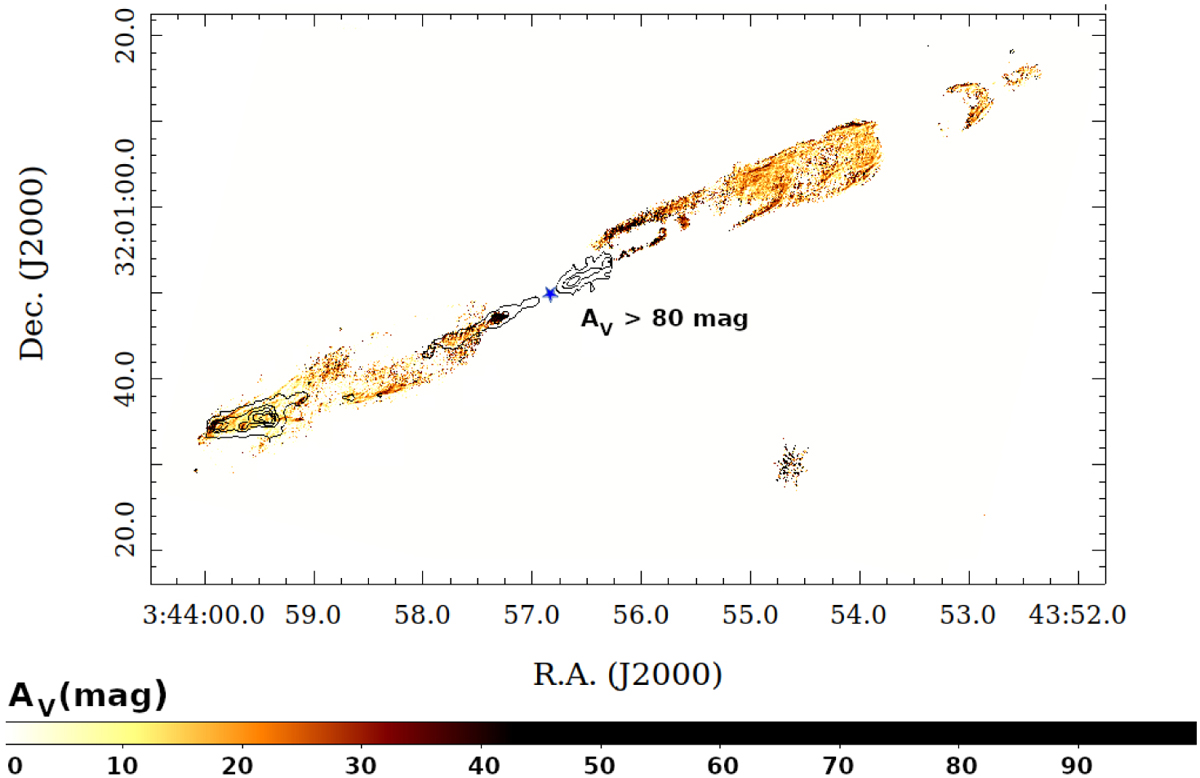
Fig. 2
Download original image
Visual extinction map of the HH 211 outflow derived from the H2 1-0 S(1) and 1-0 O(5) lines (F212N and F323N NIR-Cam images). The colour bar represents the different values in magnitude (mag). A value of AV ≥ 80 mag has been estimated using ro-vibrational diagrams for the source and jet inner regions where the H2 1-0 S(1) emission is not detected. [Fe II] (26 µm) jet contours detected in the MIRI-MRS map are shown in black (see Sect. 3.2). The position of the protostar from ALMA continuum data (see Lee et al. 2019) is also marked.
Current usage metrics show cumulative count of Article Views (full-text article views including HTML views, PDF and ePub downloads, according to the available data) and Abstracts Views on Vision4Press platform.
Data correspond to usage on the plateform after 2015. The current usage metrics is available 48-96 hours after online publication and is updated daily on week days.
Initial download of the metrics may take a while.