Fig. 13
Download original image
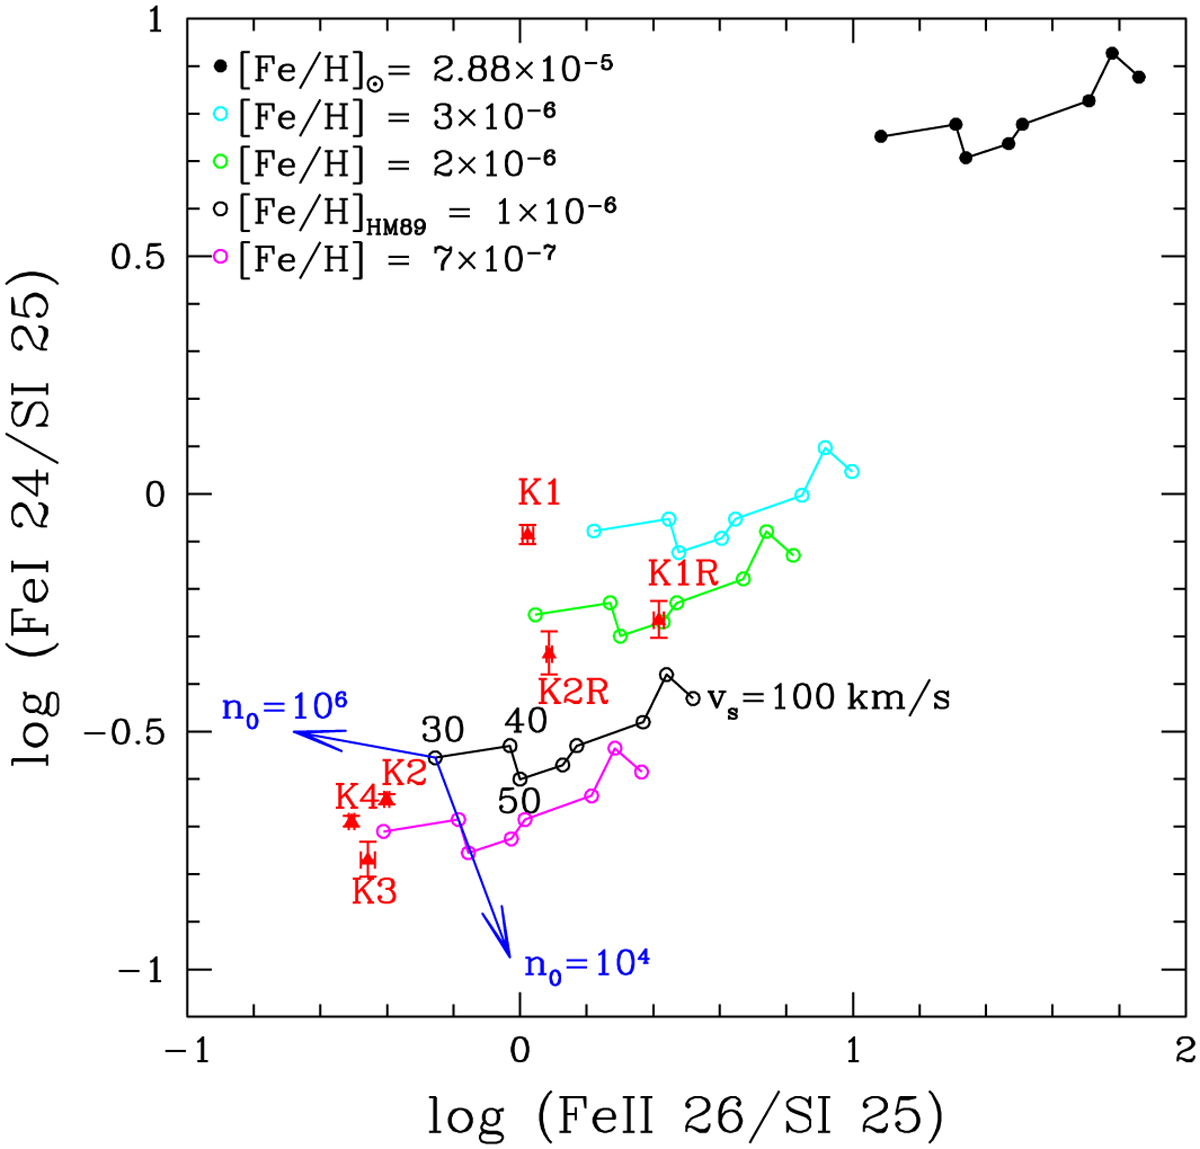
Observed vs. predicted [Fe II] 26 µm/[S I] and [Fe I]/[S I] line ratios for different knots (red triangles) along the jet. Each curve reproduces the Hollenbach & McKee (1989) dissociative models for different values of the gas-phase iron abundance (coloured curves, from 2.88 × 10⁻⁵ – black dots – to 7 × 10⁻⁷ – magenta open circles), pre-shock density n0=105 cm−3, and a range of shock velocities (vs=30–100 km s−1), as reported in the labels. The two blue arrows show how the plots move by varying n0 from 104 to 106 cm−3.
Current usage metrics show cumulative count of Article Views (full-text article views including HTML views, PDF and ePub downloads, according to the available data) and Abstracts Views on Vision4Press platform.
Data correspond to usage on the plateform after 2015. The current usage metrics is available 48-96 hours after online publication and is updated daily on week days.
Initial download of the metrics may take a while.