Fig. 12
Download original image
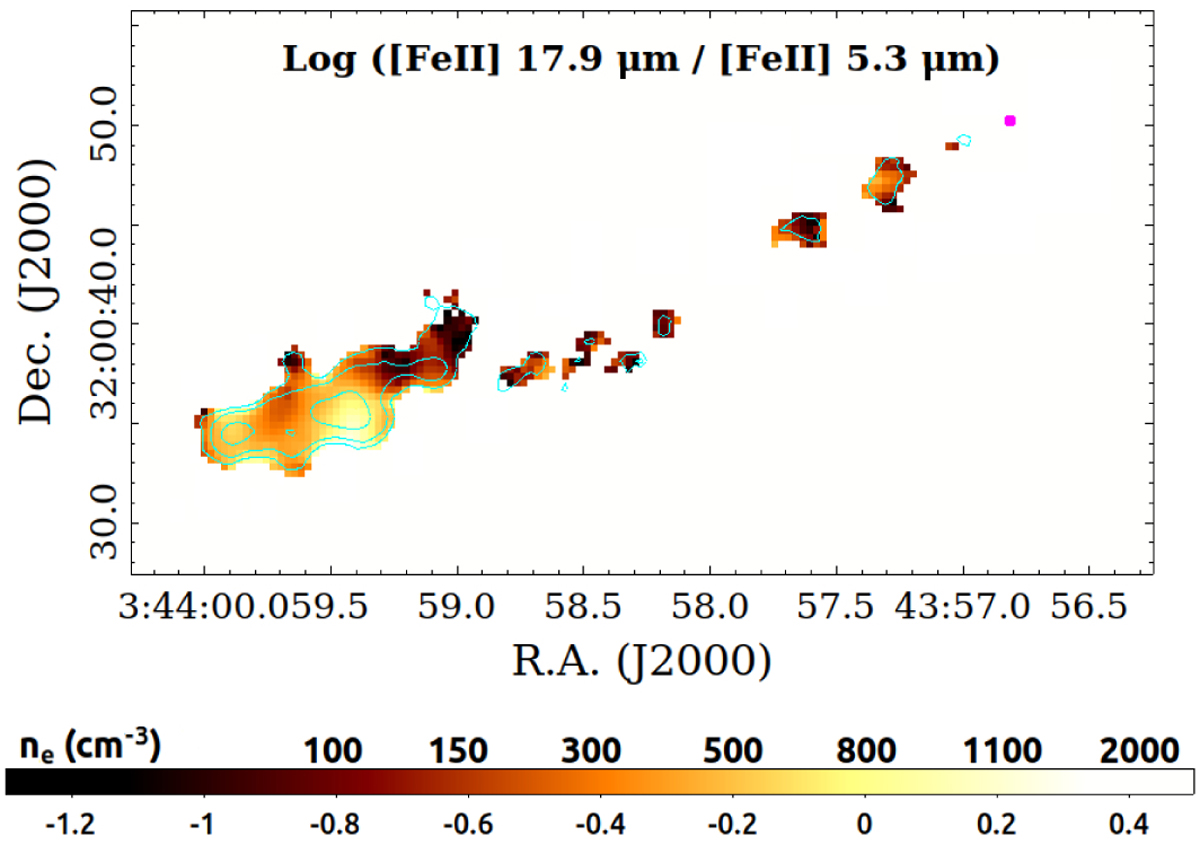
Logarithmic map of the ratio of [Fe II] lines at 17.9 and 5.3 µm. Cyan contours show the [FeII] (5.3 µm) line flux at 3, 10, and 50σ (0.1, 0.4, 2.1 mJy pixel−1). Colour code reports the logarithmic value of the ratio (bottom) and the corresponding ne (in cm−3) for an average Te of 1000 K. Only pixels within 3σ line contours are displayed. The magenta dot shows the position of the ALMA mm continuum source.
Current usage metrics show cumulative count of Article Views (full-text article views including HTML views, PDF and ePub downloads, according to the available data) and Abstracts Views on Vision4Press platform.
Data correspond to usage on the plateform after 2015. The current usage metrics is available 48-96 hours after online publication and is updated daily on week days.
Initial download of the metrics may take a while.