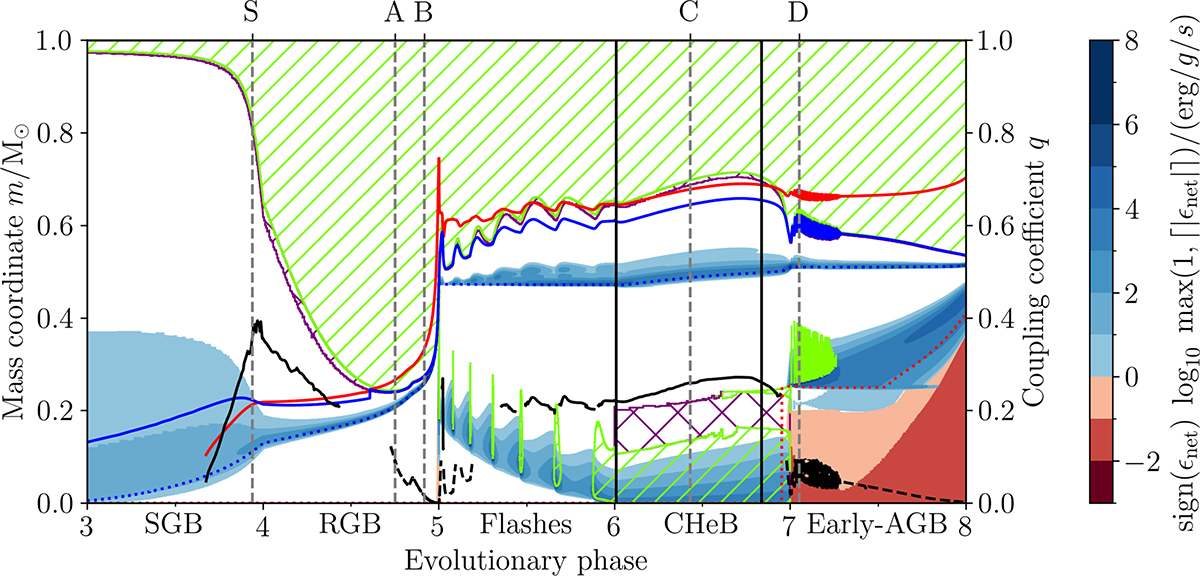
Fig. 8.
Download original image
Kippenhahn diagram of a 1 M⊙ star with solar metallicity. The x-axis shows the stellar age with different scales between evolutionary phases. The SGB is shown from 3–4, the ascent up the RGB from 4–5, the helium flashes from 5–6, CHeB from 6–7, and early-AGB from 7–8. Convection is shown by the green //-hashed regions. Convective overshoot is shown by the purple cross-hashed region. The colour scale shows the net nuclear energy generation rate. The blue dashed line shows the boundary between the helium core and hydrogen envelope. The red dashed line shows the boundary between the helium core and the CO core. Strong coupling is shown as a solid black line and weak coupling as a dashed black line. The boundaries of the evanescent zone, r1 and r2, are shown as the red and blue lines respectively. The two vertical black lines in the CHeB phase show the start and end of the RC. The locations of models A–D and S are shown as vertical dashed grey lines.
Current usage metrics show cumulative count of Article Views (full-text article views including HTML views, PDF and ePub downloads, according to the available data) and Abstracts Views on Vision4Press platform.
Data correspond to usage on the plateform after 2015. The current usage metrics is available 48-96 hours after online publication and is updated daily on week days.
Initial download of the metrics may take a while.