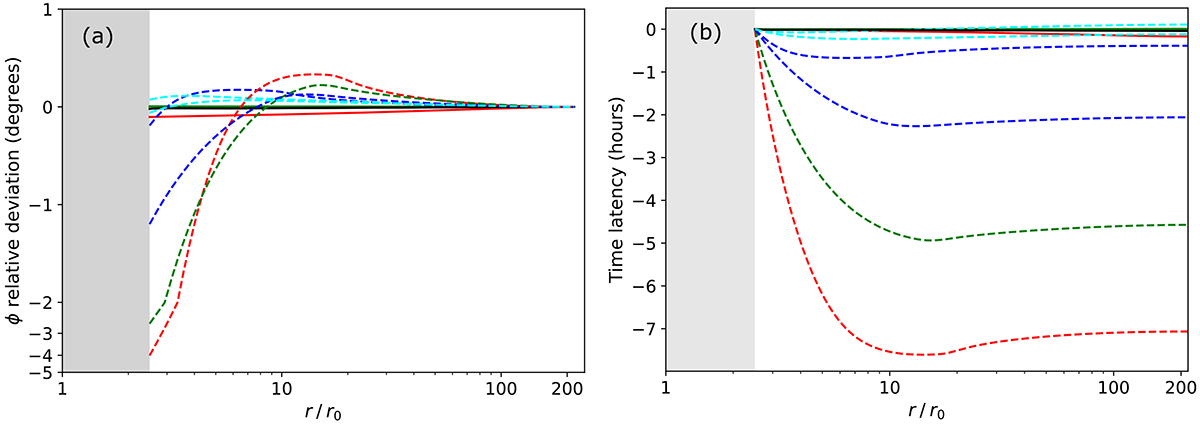
Fig. A.3.
Download original image
Streamline and travel time discrepancies between the 5 isopoly wind profiles used in the computation of the backmapping process (Dakeyo et al. 2022), and the updated 5 isopoly profiles accounting for super-radial expansion presented in Fig. 6. Panel (a): Streamline angle deviation from 1 au to rss; Panel (b): Travel time latency. The f-subsonic and the f-supersonic solutions are plotted in solid and dashed lines respectively. The wind populations, from the slowest to the fastest are shown with black, red, green, dark blue and light blue.
Current usage metrics show cumulative count of Article Views (full-text article views including HTML views, PDF and ePub downloads, according to the available data) and Abstracts Views on Vision4Press platform.
Data correspond to usage on the plateform after 2015. The current usage metrics is available 48-96 hours after online publication and is updated daily on week days.
Initial download of the metrics may take a while.