Fig. 6.
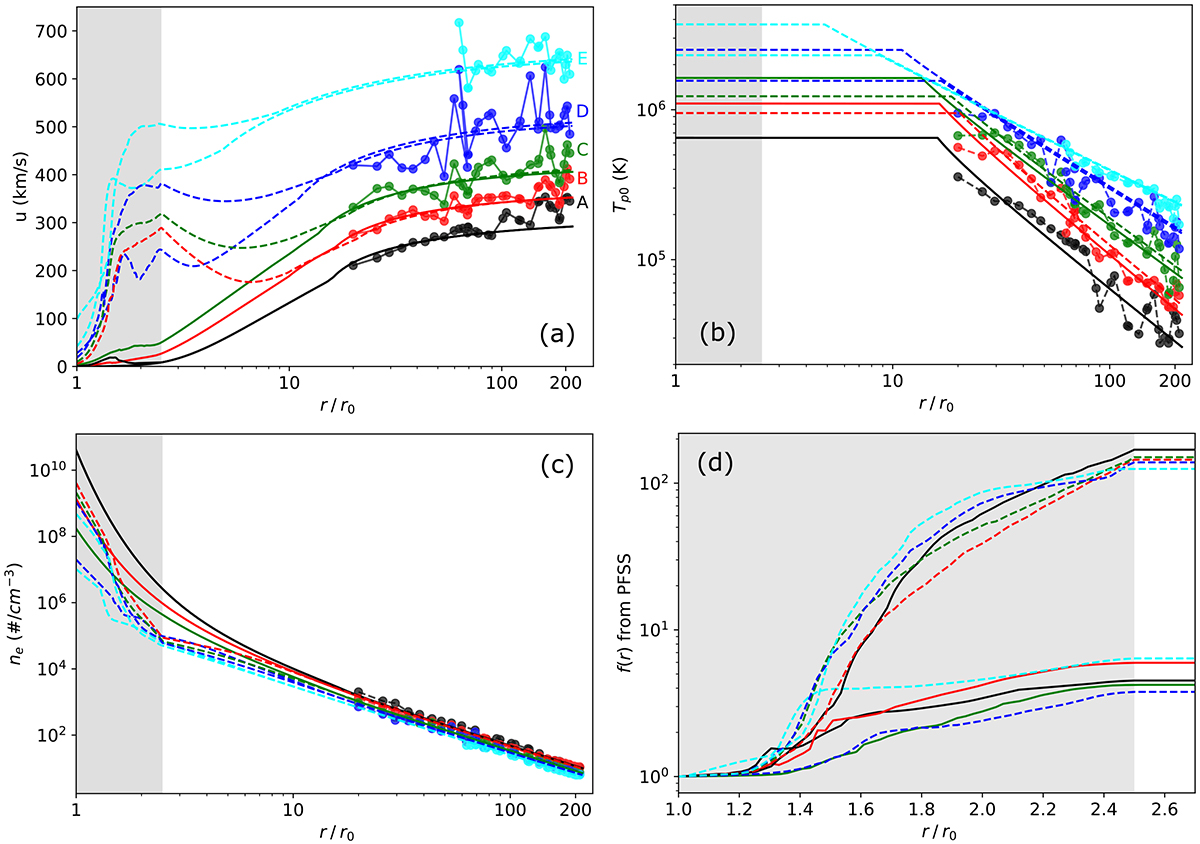
Download original image
Updated isopoly models from Eq. (8) associated with expansion factor profiles computed from PFSS, fitted to the data set used by Dakeyo et al. (2022). The f-subsonic and the f-supersonic solutions are plotted in solid and dashed lines respectively. Five isopoly models are computed for the two bins fss < 7 and 100 < fss < 250. Panel a: Updated velocity profiles; Panel b: Updated proton temperature profiles; Panel c: Updated density profiles; Panel d: Corresponding median f(r) profiles calculated from the f(r) profile obtained by the PFSS reconstruction. The data used for fitting are added in panels a–c as dots linked with straight segments. The region of super-radial expansion (up to rss = 2.5 r⊙) is delineated by the gray shaded area. The number of expansion profiles used to compute the median profiles of the [A, B, C, D, E] wind populations in panel d are [14, 16, 123, 235, 4] and [89, 360, 326, 148, 103], for fss < 7 and 100 < fss < 250, respectively.
Current usage metrics show cumulative count of Article Views (full-text article views including HTML views, PDF and ePub downloads, according to the available data) and Abstracts Views on Vision4Press platform.
Data correspond to usage on the plateform after 2015. The current usage metrics is available 48-96 hours after online publication and is updated daily on week days.
Initial download of the metrics may take a while.