Fig. 4.
Download original image
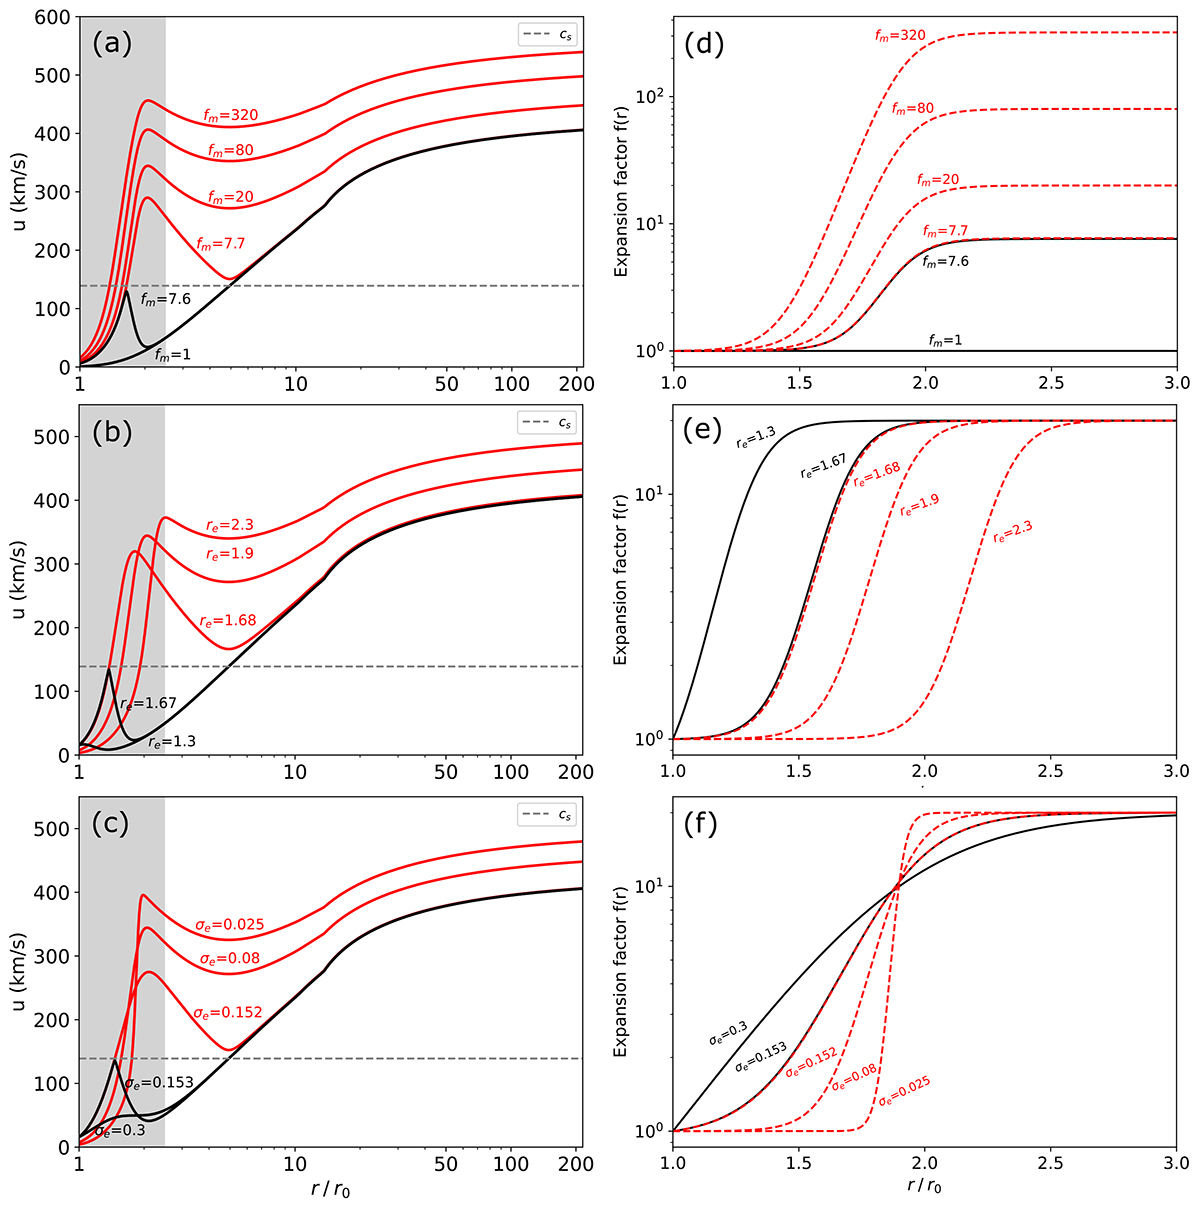
Isopoly models with super-radial expansion described by Eq. (9). The solutions embedding subsonic and supersonic regimes below 2.5 r⊙ are displayed in black solid line and red solid lines, respectively. The left panels show isopoly solutions for the same initial parameters (Tp0 = 1.63 MK, Te0 = 0.71 MK, riso|p = 13.6 r⊙, riso|e = 10.3 r⊙, γp = 1.52, γe = 1.23), with varying expansion factor parameters (fm, re, σe), and the right panels show the associated f(r) profiles; Panel a: Different values of fm (maximum expansion factor obtained for large r); Panel b: Different values of re (radius at which the super-expansion almost stops); Panel c: Different values of σe (broadness of the expansion region). The f(r) profiles associated with panels a–c are displayed in panels d–f respectively. For all the f(r) parameters not displayed in the panel are set with (fm = 20, re = 1.9 r⊙, σe = 0.08 r⊙). While PFSS is not used here, we still mark the region located below the source surface with the gray area as a guide for comparison.
Current usage metrics show cumulative count of Article Views (full-text article views including HTML views, PDF and ePub downloads, according to the available data) and Abstracts Views on Vision4Press platform.
Data correspond to usage on the plateform after 2015. The current usage metrics is available 48-96 hours after online publication and is updated daily on week days.
Initial download of the metrics may take a while.