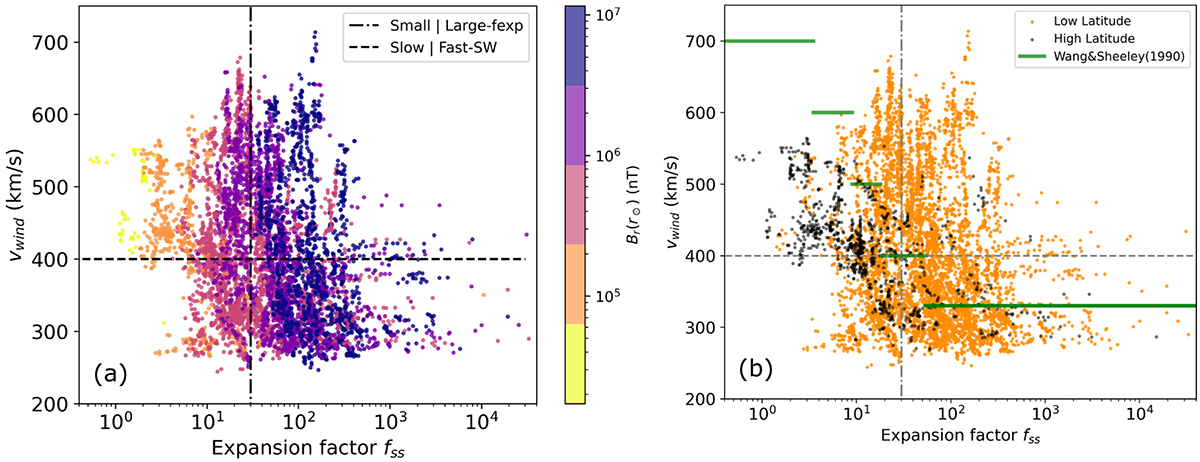
Fig. 2.
Download original image
Relationship between the measured velocity, vwind, and the final expansion factor value, fss, computed with PFSS from the back-mapping applied to the data in Fig. 1. Panel a: The wind speed, vwind, measured by Solar Orbiter as a function of the expansion factor, fss, calculated using PFSS at the source surface (located at rss). The mapping results cover from 1/08/2020 to 17/03/2022. The photospheric magnetic field is displayed with the color coding shown in the color bar, and with partial transparency to limit the masking effect. The distribution has a Pearson correlation coefficient of −0.27. Panel b: Same as panel a but colored in black for low unsigned latitudes (< 45°) and in orange for high latitude footpoints (> 45°) for each mapped observation. The typical range of values from Wang & Sheeley (1990) study, mapping observation at 1 au, are displayed by the horizontal green bars. The high and low latitudes distributions have a Pearson correlation coefficient of −0.51 and −0.24, respectively.
Current usage metrics show cumulative count of Article Views (full-text article views including HTML views, PDF and ePub downloads, according to the available data) and Abstracts Views on Vision4Press platform.
Data correspond to usage on the plateform after 2015. The current usage metrics is available 48-96 hours after online publication and is updated daily on week days.
Initial download of the metrics may take a while.