Fig. 1.
Download original image
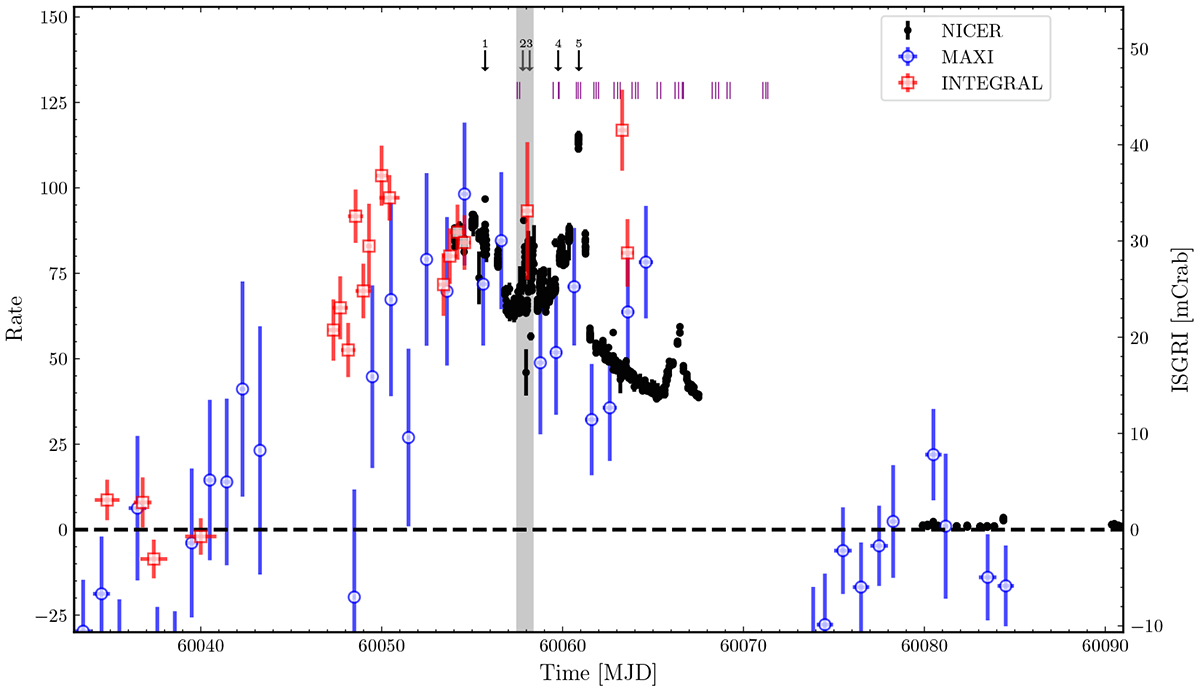
Light curves of IGR J17498−2921 from NICER (black dot, 0.5–10 keV, in units of cnt s−1), MAXI/GSC (blue open circle, 2.0–6.0 keV), and INTEGRAL/ISGRI (red open square, 20–60 keV) during its 2023 outburst. The MAXI rate is in units of ph cm−2 s−1 multiplied by 560 to overlap with the NICER data. The scale of the 20–60 keV ISGRI light curve is shown along the right vertical axis and is given in units of mCrab. The grey area presents the epoch of NuSTAR observations. The black arrows on the upper center mark the start time of five type I X-ray bursts with burst number. The horizontal dashed line shows the background level. The vertical purple lines present the start time of Insight-HXMT observations. The count rates of the three Insight-HXMT instruments were polluted by several nearby (Galactic center) sources; therefore, they are not included here.
Current usage metrics show cumulative count of Article Views (full-text article views including HTML views, PDF and ePub downloads, according to the available data) and Abstracts Views on Vision4Press platform.
Data correspond to usage on the plateform after 2015. The current usage metrics is available 48-96 hours after online publication and is updated daily on week days.
Initial download of the metrics may take a while.