Fig. 3.
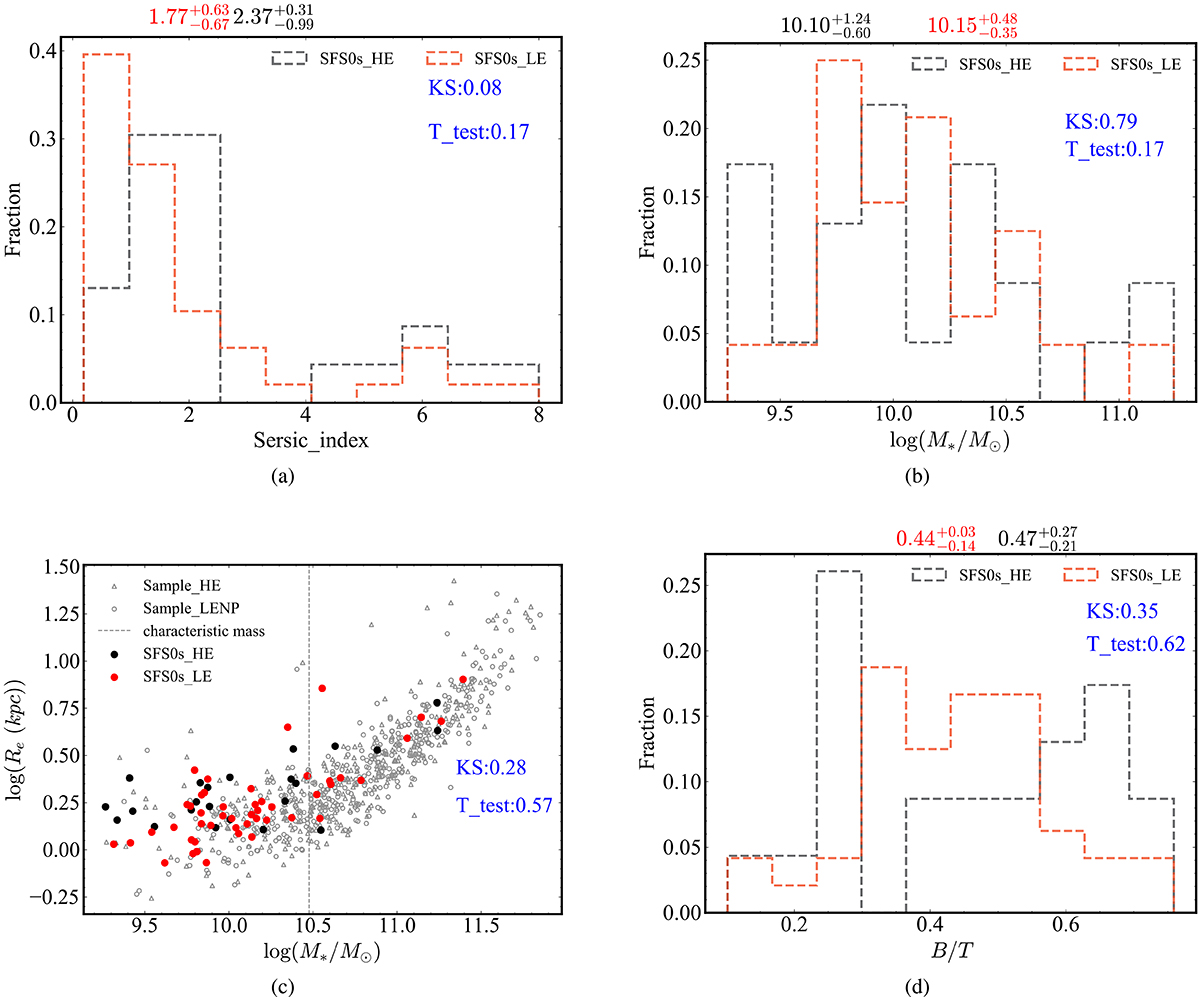
Download original image
The global properties of our two samples. (a) Distributions of the bulges Sérsic index, which come from MaNGA_VAC photometrical catalog; (b) Stellar mass (M*) distribution; (c) SMR. The gray dashed line represents the characteristic mass (“pivot mass”, M* ≈ 3 × 10¹⁰) of the SMR bend (Cappellari 2016; Mowla et al. 2019; Kawinwanichakij et al. 2021); In this figure, black and red circles represent our two samples and the rest are the same as Fig. 1; (d) The bulge-to-total (B/T) light ratio distribution from Ser+Exp fit, which also comes from the photometrical catalog (r-band). In this picture, the top numbers represent the average of the parameters for our two samples, while the blue numbers in the picture represent different test results. The color markings are the same as in Fig. 1.
Current usage metrics show cumulative count of Article Views (full-text article views including HTML views, PDF and ePub downloads, according to the available data) and Abstracts Views on Vision4Press platform.
Data correspond to usage on the plateform after 2015. The current usage metrics is available 48-96 hours after online publication and is updated daily on week days.
Initial download of the metrics may take a while.