Fig. 1.
Download original image
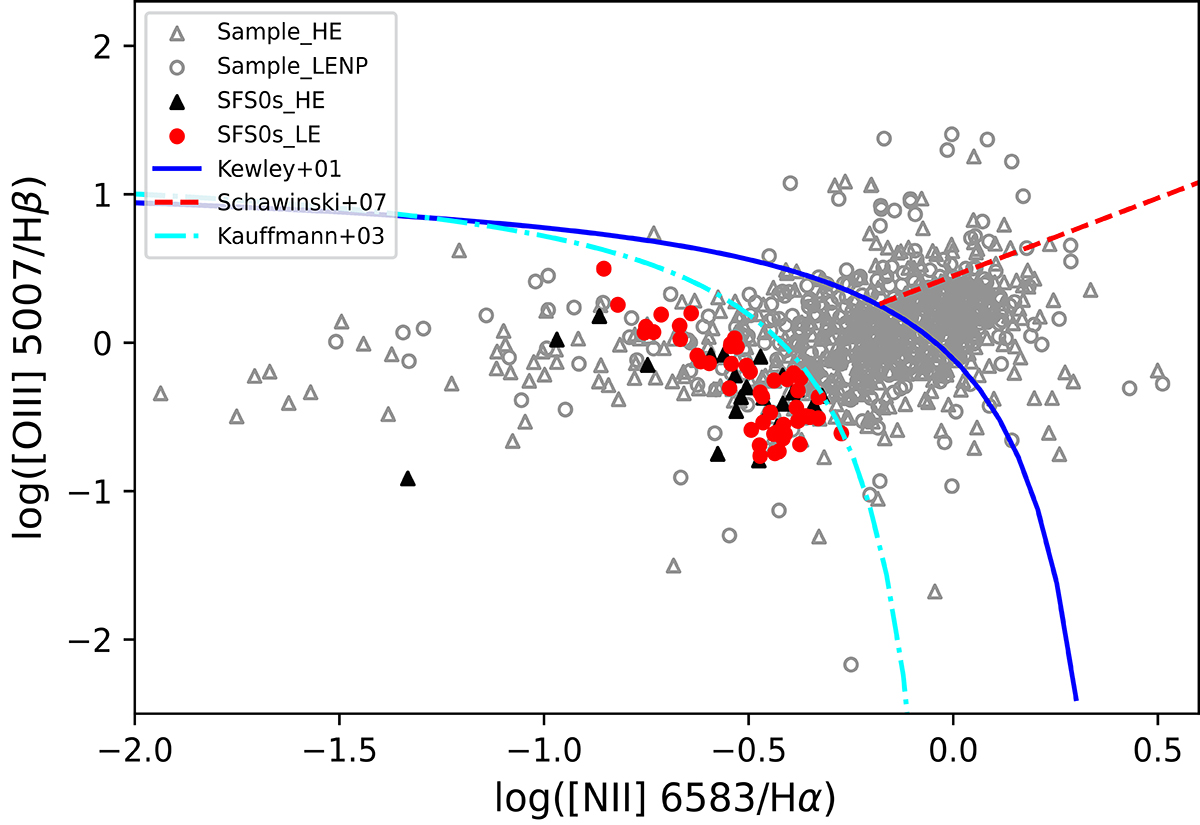
Global BPT diagnosis of our samples. The cyan dotted line, blue solid line, and red dashed line are the theoretical curves from Kauffmann et al. (2003), Kewley et al. (2001), and Schawinski et al. (2007), respectively. The marks of a triangle in this figure are Sample_HE, while the marks of a circle represent Sample_LENP. Our SFS0s_HE galaxies are represented by the black-filled triangles, and the red-filled circles represent sample SFS0s_LE. Y-axis is the log([OIII] 5007/Hβ), and X-axis is the log([NII] 6583/Hα), both from Pipe3D v3_1_1 catalog.
Current usage metrics show cumulative count of Article Views (full-text article views including HTML views, PDF and ePub downloads, according to the available data) and Abstracts Views on Vision4Press platform.
Data correspond to usage on the plateform after 2015. The current usage metrics is available 48-96 hours after online publication and is updated daily on week days.
Initial download of the metrics may take a while.