Fig. 5.
Download original image
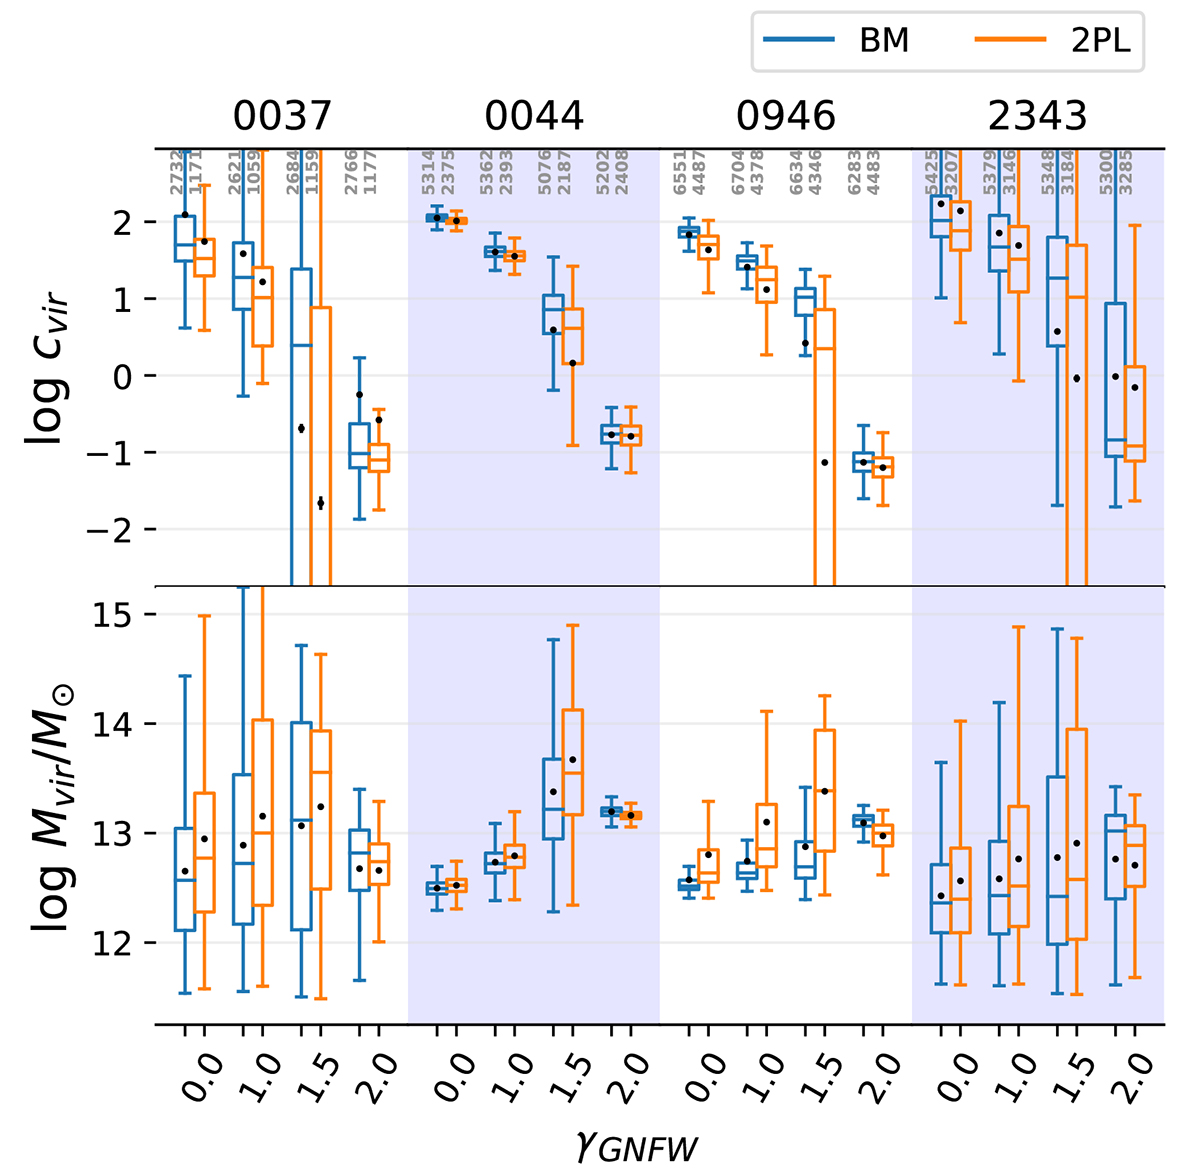
Box plot of concentrations (top panel) and virial masses (bottom panel) plotted against γGNFW for the four lenses J0037, J0044, J0946, and J2343. Mean values and standard errors are shown as black dots with error bars in addition to the box plots showing the interquartile range (25–75%) and whiskers at the 90% confidence interval. The small vertical numbers show how many of the original 10 000 realisations produced viable fits.
Current usage metrics show cumulative count of Article Views (full-text article views including HTML views, PDF and ePub downloads, according to the available data) and Abstracts Views on Vision4Press platform.
Data correspond to usage on the plateform after 2015. The current usage metrics is available 48-96 hours after online publication and is updated daily on week days.
Initial download of the metrics may take a while.