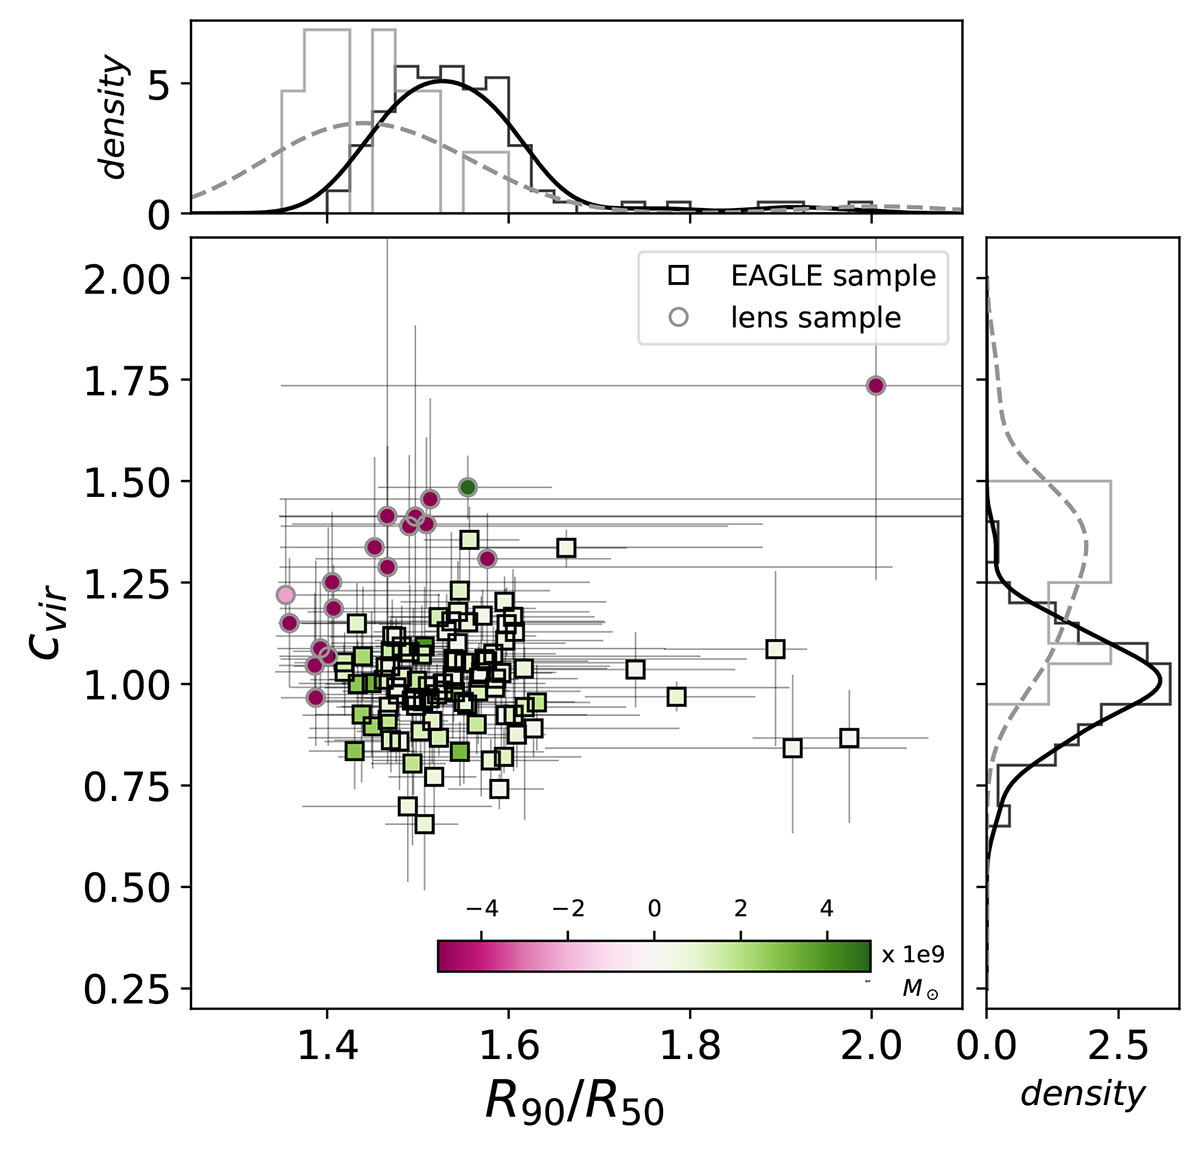
Fig. 4.
Download original image
Virial concentration versus non-parametric R90/R50. The colours represent median values of the residuals of the NFW-fits. The lens sample (circles) shows mostly large negative residuals (magenta), whereas the EAGLE sample (squares) shows small positive residuals (green). The X- and Y-axis histograms show two populations: kernel densities for the EAGLE sample (solid black line) and the lens sample (dashed grey line). A two-sample KS test for cvir and R90/R50 for a significance level of α = 0.001 indicated that the two samples are drawn from different populations.
Current usage metrics show cumulative count of Article Views (full-text article views including HTML views, PDF and ePub downloads, according to the available data) and Abstracts Views on Vision4Press platform.
Data correspond to usage on the plateform after 2015. The current usage metrics is available 48-96 hours after online publication and is updated daily on week days.
Initial download of the metrics may take a while.