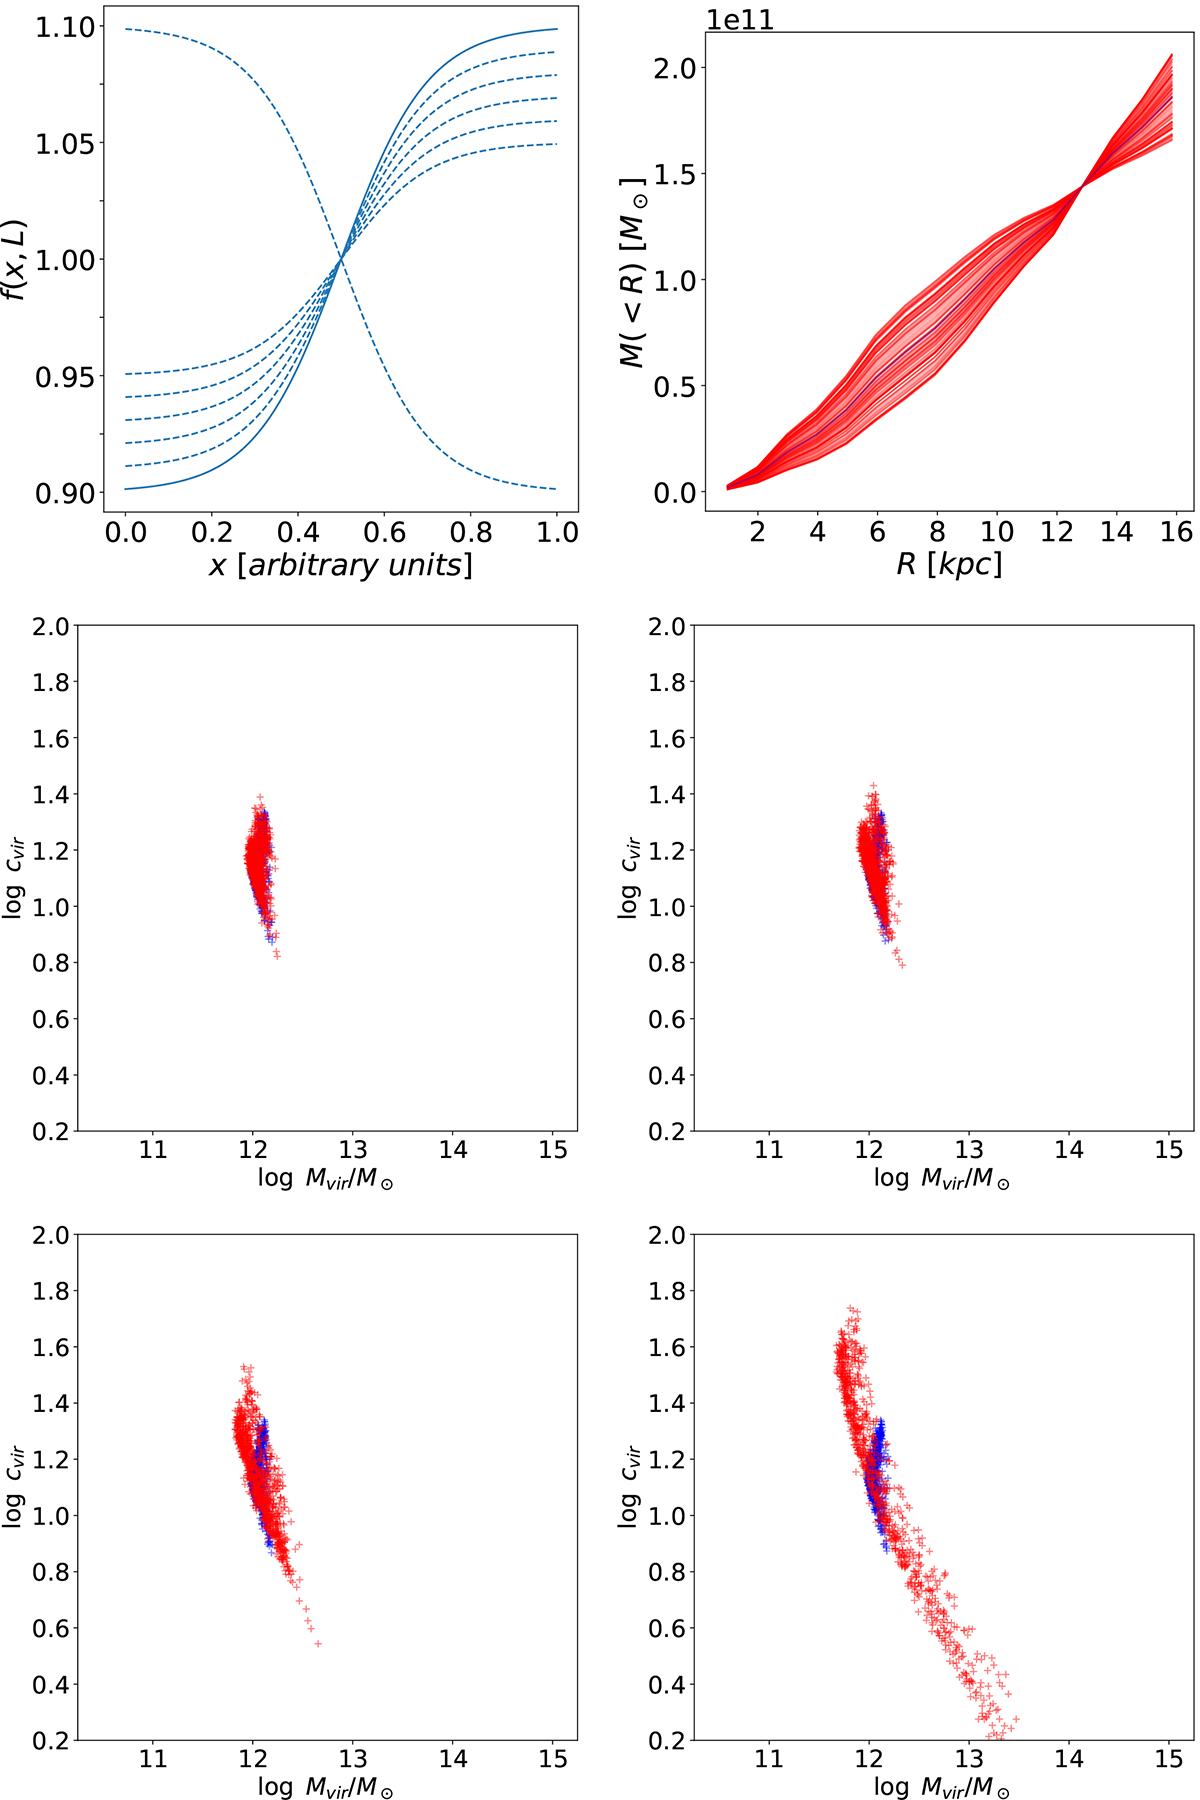
Fig. 3.
Download original image
Top left: Distortion function according to Eq. (1). The solid line represents the L = 0.1 case; the dashed lines show the cases of L = 0.09 to L = −0.1. Top right: One hundred realisations of an enclosed DM mass profile (from J1525) modified by random distortion functions with L varying from –0.5 to 0.5. Middle left to bottom right panel: Changing concentration to virial mass relation for 1000 realisation with randomly chosen L-values (0.05, middle left; 0.1 middle right; 0.2, bottom left; 0.5, bottom right) shown in red. The blue point cloud represents the fits to the original DM profiles.
Current usage metrics show cumulative count of Article Views (full-text article views including HTML views, PDF and ePub downloads, according to the available data) and Abstracts Views on Vision4Press platform.
Data correspond to usage on the plateform after 2015. The current usage metrics is available 48-96 hours after online publication and is updated daily on week days.
Initial download of the metrics may take a while.