Fig. 1.
Download original image
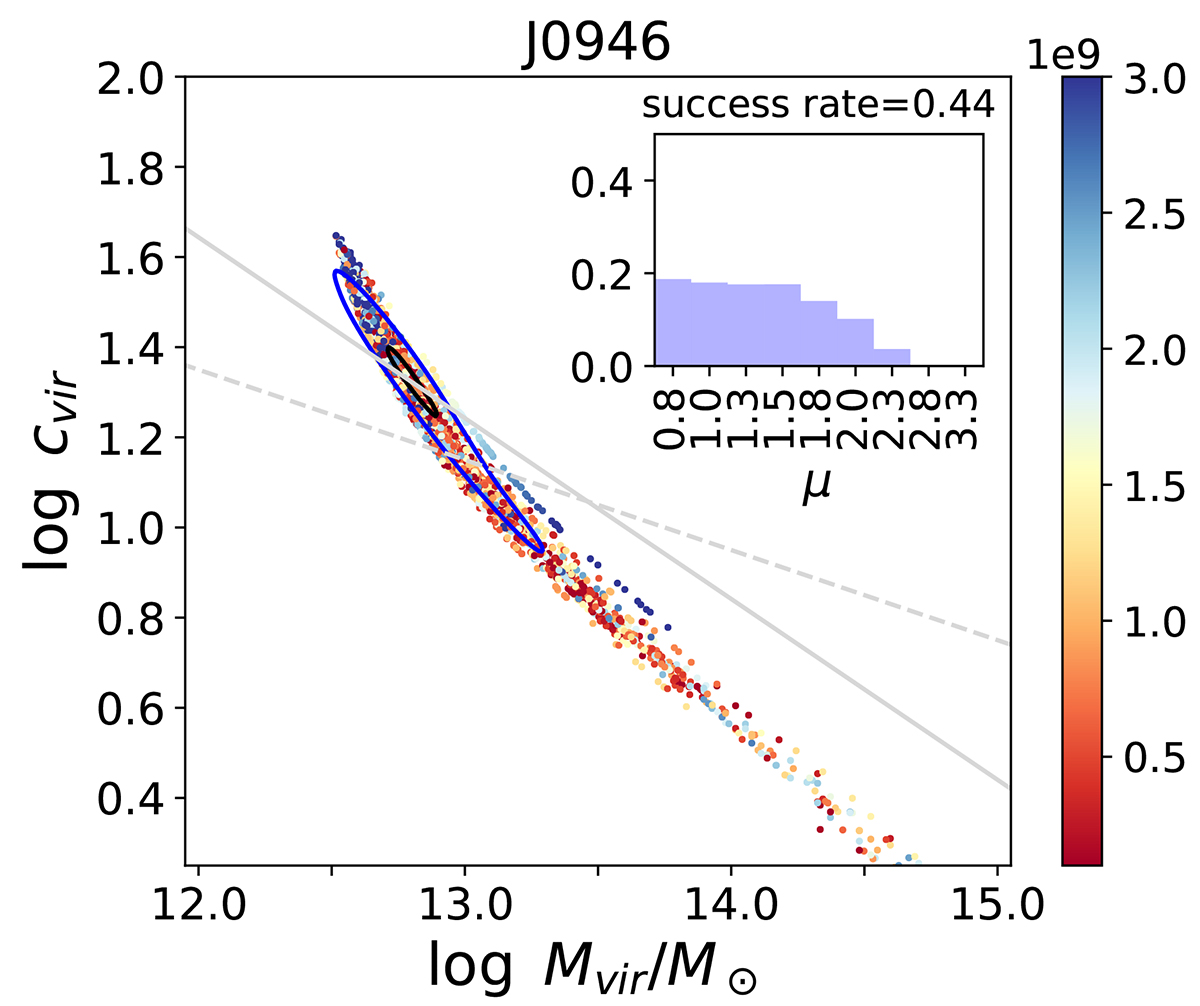
Point cloud of successful combinations of lensing and stellar mass profiles on the c-M plane for lens J0946 representing the success rate. The colour scale indicates the MAE of the fitted models, where lower values correspond to a better goodness-of-fit. The 95% (68%) kernel density estimate contours are shown in blue (black). The solid grey line represents the c-M relation from Leier et al. (2022), while the dashed line is from Buote et al. (2007). The inset displays the frequency distribution of successful realisations as a function of the IMF slope, with very bottom-heavy IMFs leading to dark matter profiles that result in unsuccessful fits.
Current usage metrics show cumulative count of Article Views (full-text article views including HTML views, PDF and ePub downloads, according to the available data) and Abstracts Views on Vision4Press platform.
Data correspond to usage on the plateform after 2015. The current usage metrics is available 48-96 hours after online publication and is updated daily on week days.
Initial download of the metrics may take a while.