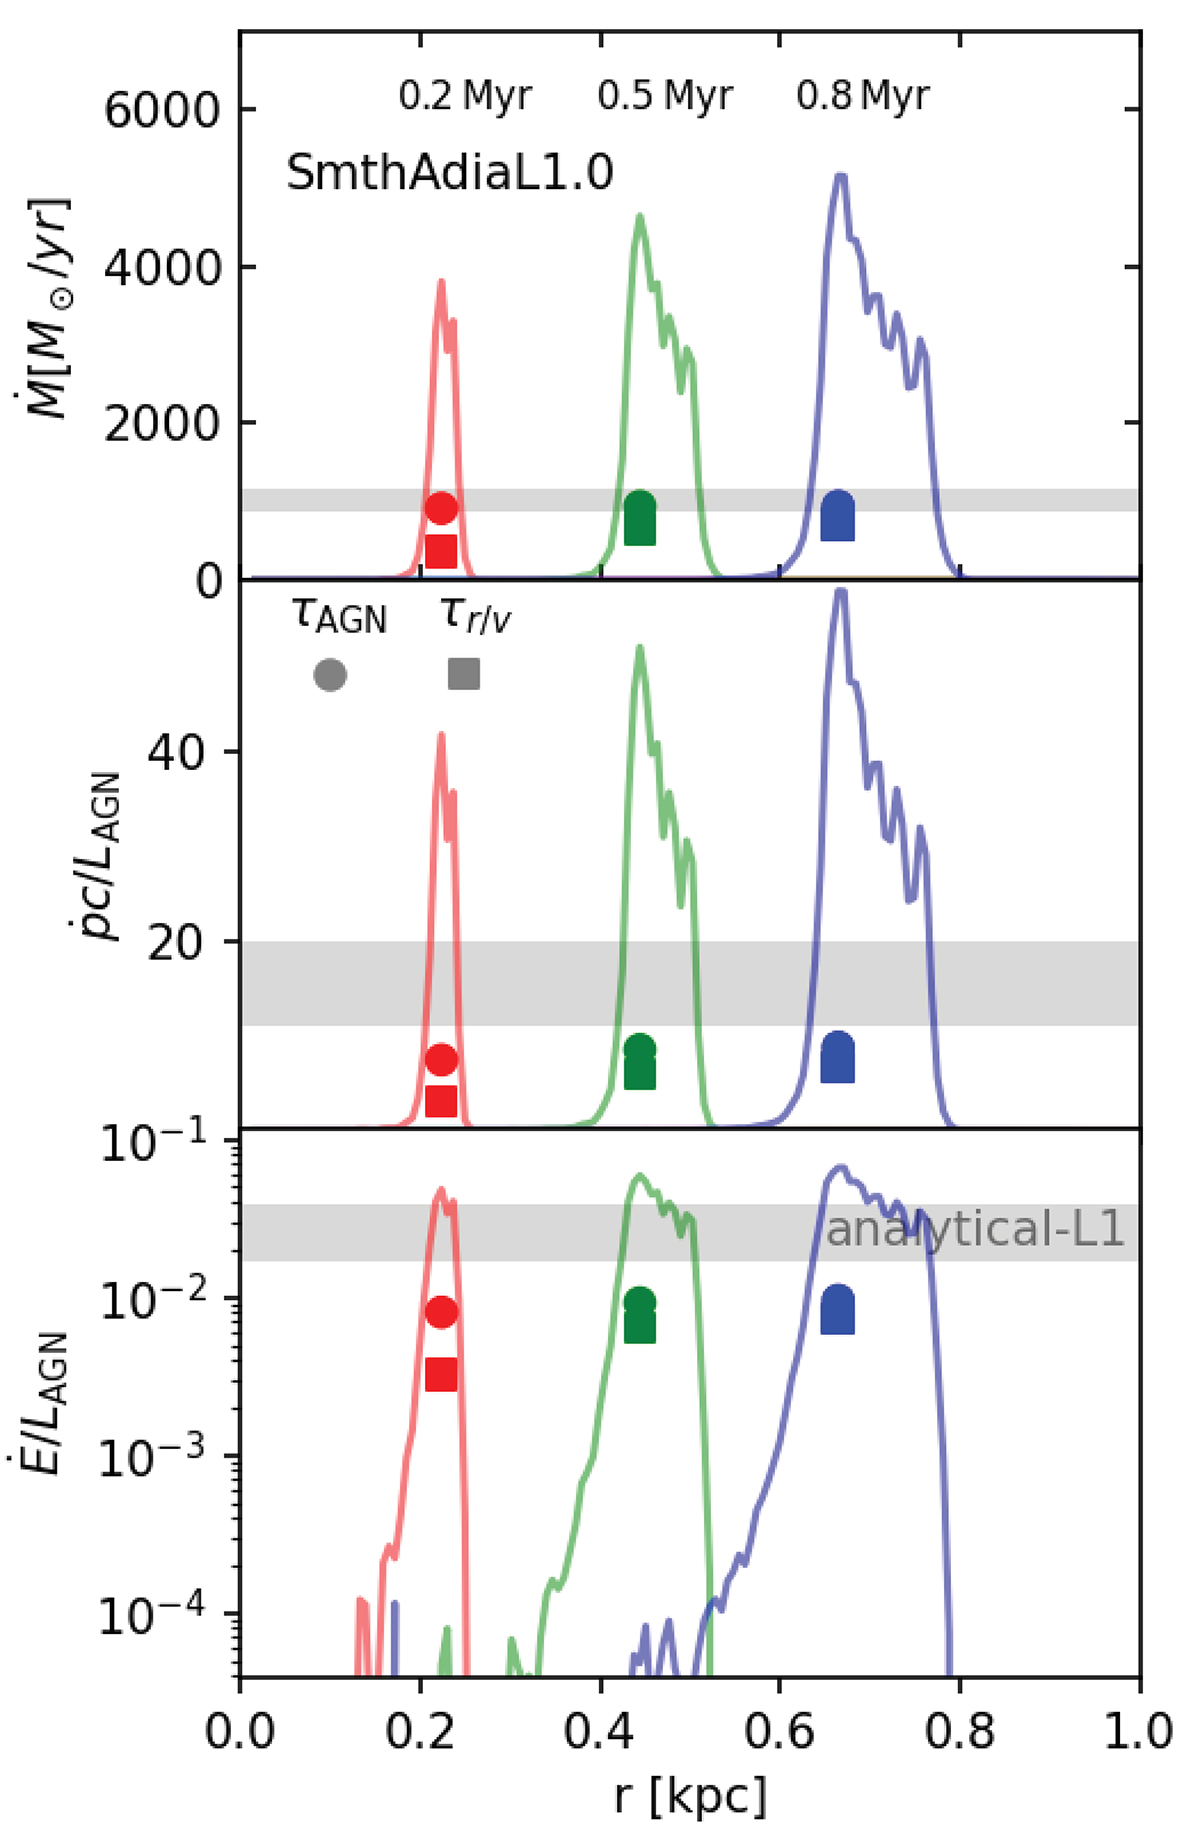
Fig. 2.
Download original image
Radial profiles of the mass outflow rate (top), momentum loading factor (middle), and energy loading factor (bottom) in simulations SmthAdiaL1.0 (solid lines and dark points) at t = 0.2 Myr (red), t = 0.5 Myr (green), and t = 0.8 Myr (blue). Lines show the radial profiles calculated using Eqs. (12), (13), and (14), the latter two converted into loading factors. Points show the globally averaged values calculated using τAGN (circles) and τr/v (squares). Grey-shaded areas show the range of analytical estimates.
Current usage metrics show cumulative count of Article Views (full-text article views including HTML views, PDF and ePub downloads, according to the available data) and Abstracts Views on Vision4Press platform.
Data correspond to usage on the plateform after 2015. The current usage metrics is available 48-96 hours after online publication and is updated daily on week days.
Initial download of the metrics may take a while.