Fig. 7
Download original image
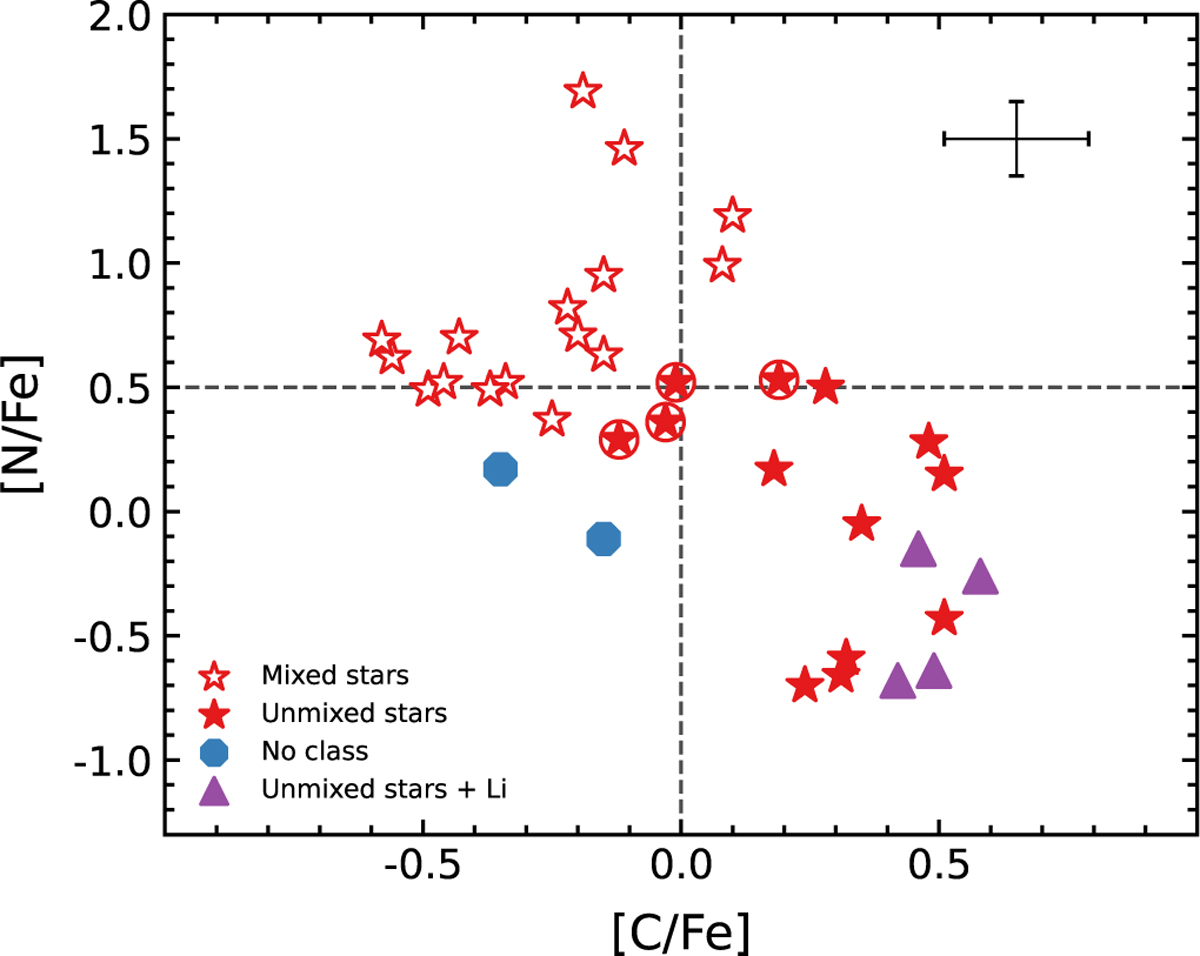
[N/Fe] versus [C/Fe] for our sample. The mixed and unmixed stars are classified based on Spite et al. (2005) and considering the estimated uncertainties for each element. The open red star markers represent the mixed stars, while the filled red star markers represent the unmixed stars; the violet triangles are the unmixed stars for which we also found Li abundances; and the blue hexagons are the stars CES 0221–2130 and CES 0424–1501 outside the adopted limits for mixed and unmixed stars. The encircled red stars marker are unmixed stars classified within the abundance uncertainties and are located after the RGB Bump in the HR diagram. A representative error bar is plotted in the upper-right corner of the figure.
Current usage metrics show cumulative count of Article Views (full-text article views including HTML views, PDF and ePub downloads, according to the available data) and Abstracts Views on Vision4Press platform.
Data correspond to usage on the plateform after 2015. The current usage metrics is available 48-96 hours after online publication and is updated daily on week days.
Initial download of the metrics may take a while.