Fig. 6
Download original image
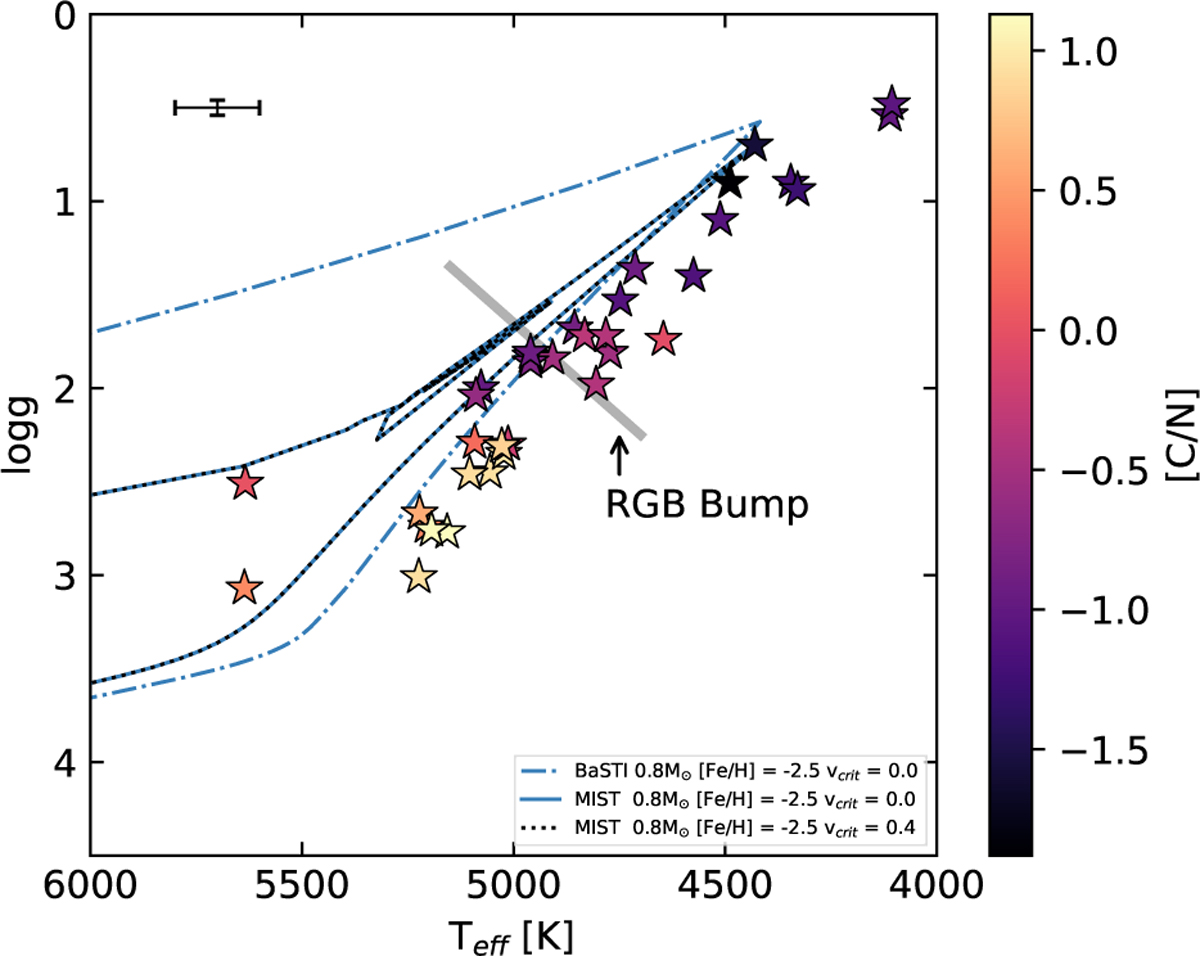
CERES stars in the Teff − log ɡ diagram. The BaSTI evolutionary track (blue dash-dotted line) has an α-enhanced chemical mixture and does not include rotation. Two MIST evolutionary tracks are also included for non-rotating (blue continuous line) and with rotation vcrit = 0.4 (gray dotted line). All the tracks are for M = 0.8 M⊙ and [Fe/H] = −2.50 dex. The RGB Bump for the adopted tracks is at Teff ~ 4880 K and log ɡ ~1.95 dex. The color index on the right side of the figure indicates the [C/N] abundance ratio. The dispersion in Teff and log ɡ measurements is represented by the error bar in the upper left corner of the figure.
Current usage metrics show cumulative count of Article Views (full-text article views including HTML views, PDF and ePub downloads, according to the available data) and Abstracts Views on Vision4Press platform.
Data correspond to usage on the plateform after 2015. The current usage metrics is available 48-96 hours after online publication and is updated daily on week days.
Initial download of the metrics may take a while.