Fig. 3
Download original image
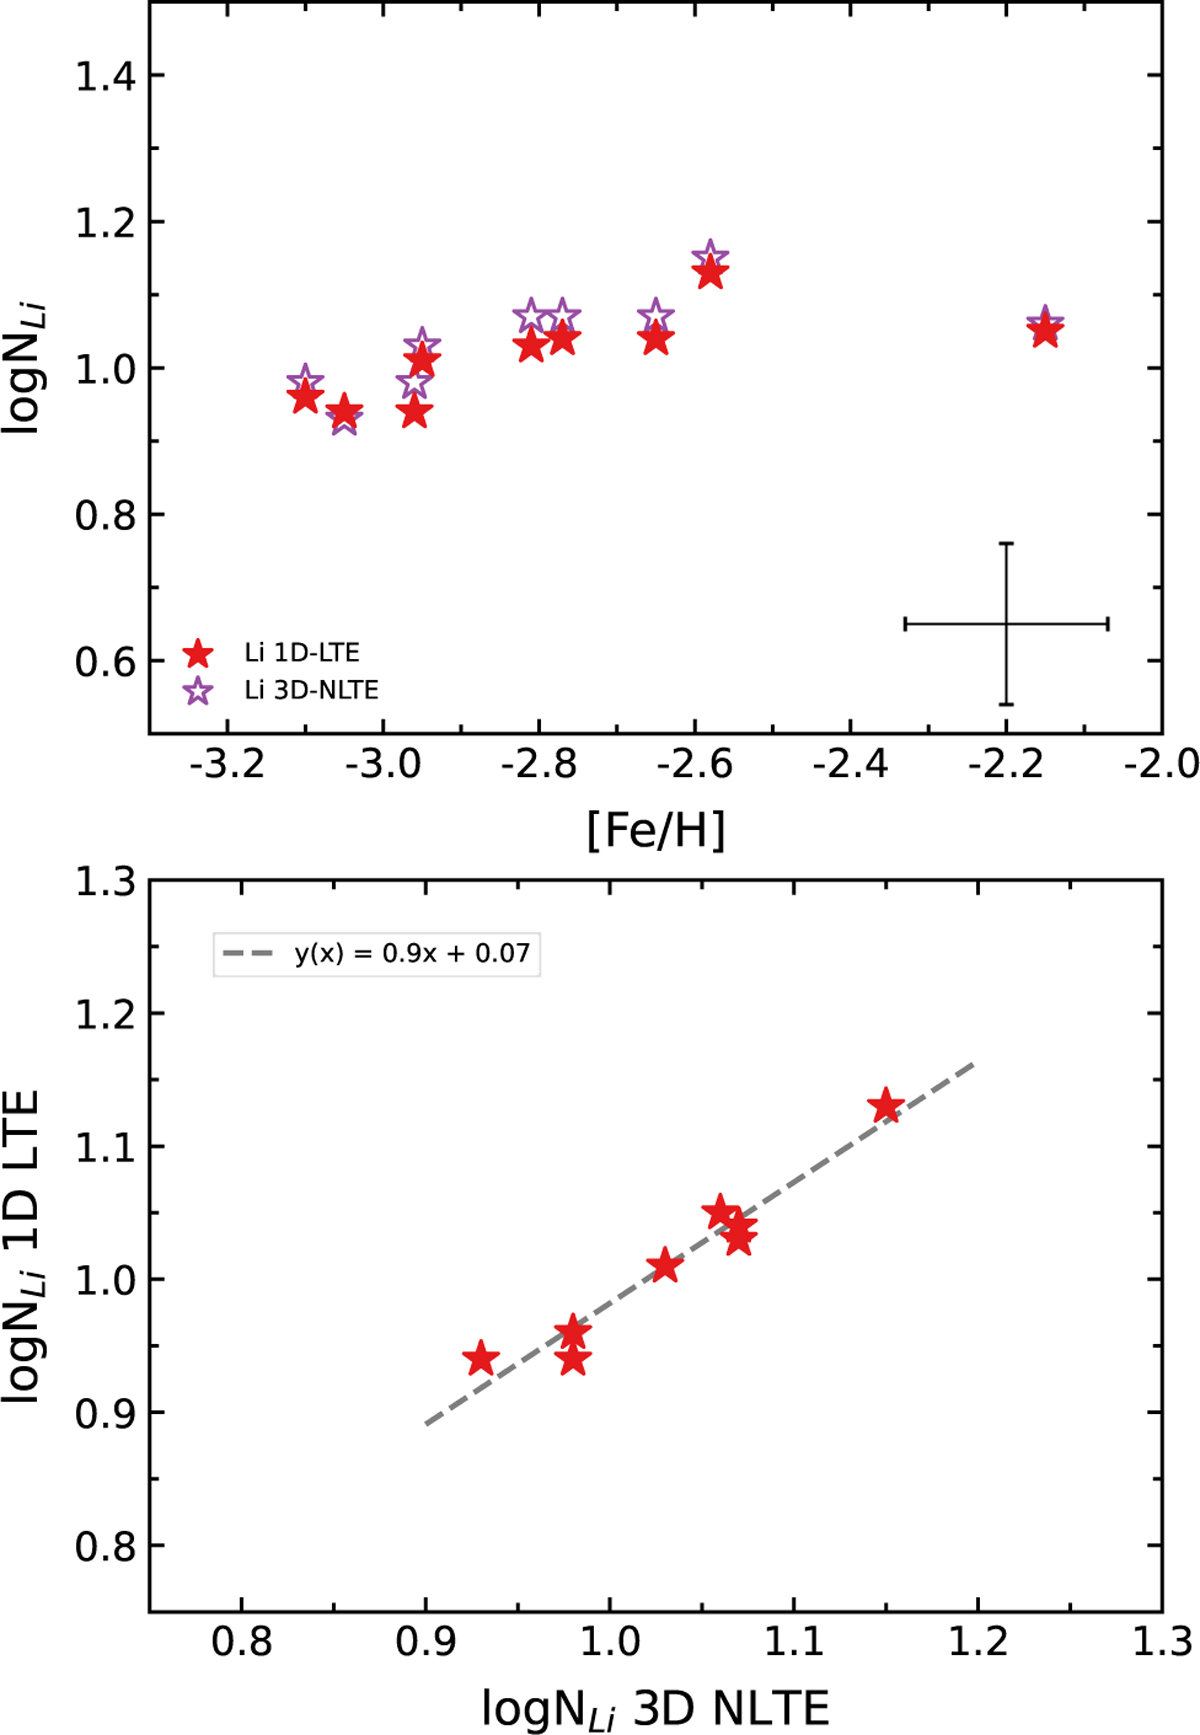
Lithium abundances obtained with our 1D LTE analysis (red symbols) and corrected for 3D NLTE effects (violet open symbols) as a function of [Fe/H] for the stars in our sample (top). A representative error bar is plotted in the lower-right corner of the figure. In the lower panel, we compare both 1D LTE and 3D NLTE lithium abundances. The stars CES 1543+0201 and CES 2231–3238 overlap around log NLi = 1.04 and log NLi 3D NLTE = 1.07.
Current usage metrics show cumulative count of Article Views (full-text article views including HTML views, PDF and ePub downloads, according to the available data) and Abstracts Views on Vision4Press platform.
Data correspond to usage on the plateform after 2015. The current usage metrics is available 48-96 hours after online publication and is updated daily on week days.
Initial download of the metrics may take a while.