Fig. 2
Download original image
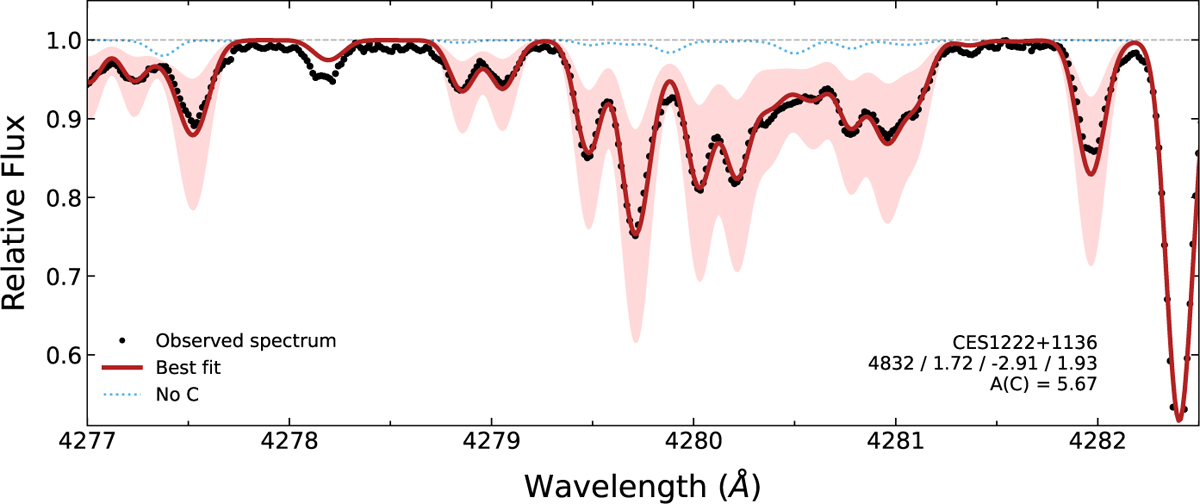
Portion of the spectrum of star CES 1222+1136, showing the G band on the region 4277–4282 Å. The solid curves show the best fit with A(C) = 5.67 (thicker red line), and the red shaded areas display A(C) ± 0.30 dex. The dotted blue line represents the synthesis if C is fully removed. The atmospheric parameters Teff (K), log ɡ, [Fe/H], and υturb (km s−1) are shown in the lower right corner.
Current usage metrics show cumulative count of Article Views (full-text article views including HTML views, PDF and ePub downloads, according to the available data) and Abstracts Views on Vision4Press platform.
Data correspond to usage on the plateform after 2015. The current usage metrics is available 48-96 hours after online publication and is updated daily on week days.
Initial download of the metrics may take a while.