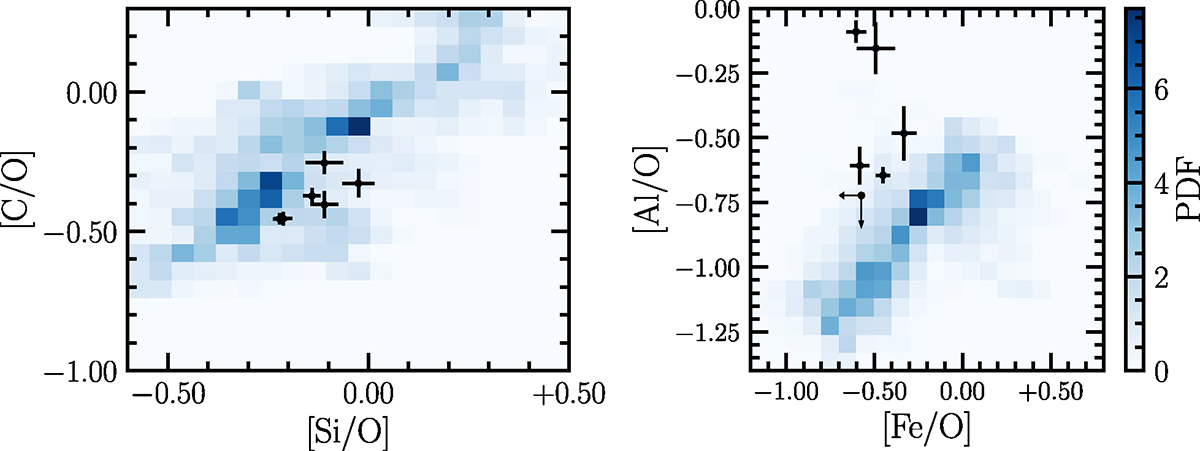
Fig. 9.
Download original image
The [C/O], [Si/O], [Al/O], and [Fe/O] abundance ratios of the systems that make up our sample (black symbols with error bars) overplotted on the joint probability distributions (blue shaded distributions) of [C/O] and [Si/O] (left) and [Al/O] and [Fe/O] (right) of the best-fit enrichment model. Overall the EMP DLA data are well-described by the inferred enrichment model. Though, there are signs that the DLAs with [Al/O] abundances close to the solar value may be challenging to reproduce.
Current usage metrics show cumulative count of Article Views (full-text article views including HTML views, PDF and ePub downloads, according to the available data) and Abstracts Views on Vision4Press platform.
Data correspond to usage on the plateform after 2015. The current usage metrics is available 48-96 hours after online publication and is updated daily on week days.
Initial download of the metrics may take a while.