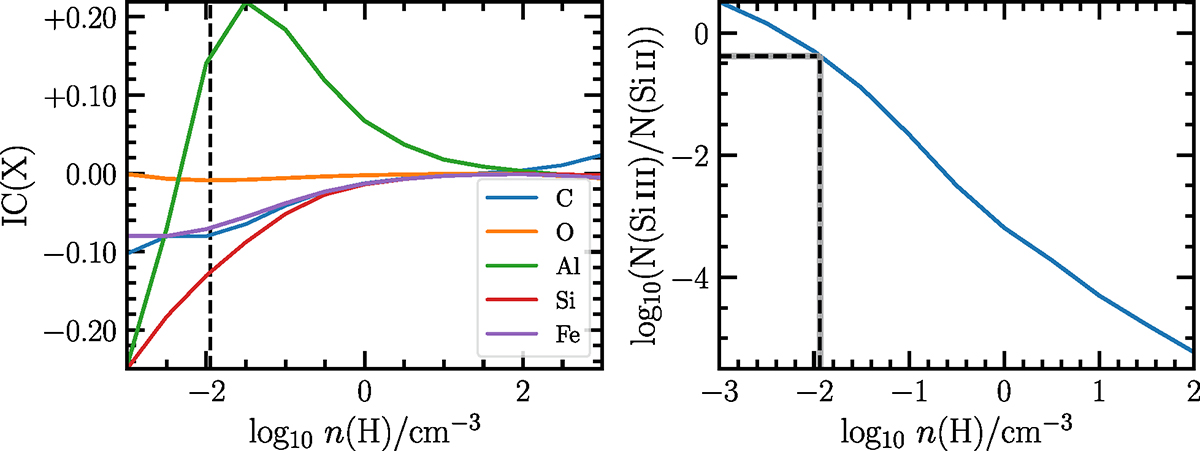
Fig. 6.

Download original image
Left: ionization corrections for the EMP DLA toward J1147+5034. We plot the expected correction for all of the observed elements as a function of gas volume density. The vertical dashed line correspond to the estimated gas density of the DLA. Right: column density ratio of successive ion stages of Si versus gas density. We also plot the observed values of the Si III/Si II ion ratio (dashed lines with gray shaded region encompassing the associated errors) and use this to determine the associated gas density. This highlights that O I is stable against ionization corrections and the impact on Fe II would only serve to increase the enhancement of [O/Fe] observed for EMP DLAs relative to VMP DLAs.
Current usage metrics show cumulative count of Article Views (full-text article views including HTML views, PDF and ePub downloads, according to the available data) and Abstracts Views on Vision4Press platform.
Data correspond to usage on the plateform after 2015. The current usage metrics is available 48-96 hours after online publication and is updated daily on week days.
Initial download of the metrics may take a while.


