Fig. 3.
Download original image
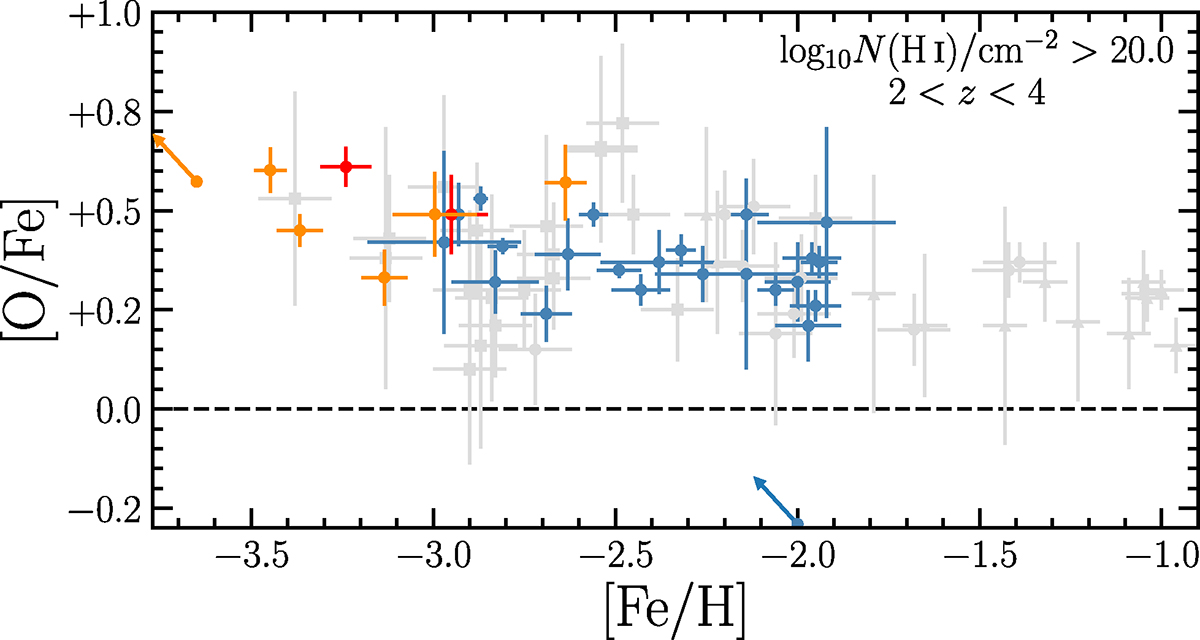
[O/Fe] vs. [Fe/H] of DLAs and sub-DLAs. Blue data are from the literature compilation in Welsh et al. (2022) and the red points are the data presented in that work. The orange points are the DLAs presented in this work combined with the results of Welsh et al. (2023). The arrows represent systems with Fe II column densities known as upper limits. Note that we do not plot the abundances of J2150+0331 in this figure since the column density of neutral hydrogen does not meet the criteria of log10N(H I)/cm−2 > 20.0 (within the associated errors). The abundances of metal-poor stars are shown as gray symbols.
Current usage metrics show cumulative count of Article Views (full-text article views including HTML views, PDF and ePub downloads, according to the available data) and Abstracts Views on Vision4Press platform.
Data correspond to usage on the plateform after 2015. The current usage metrics is available 48-96 hours after online publication and is updated daily on week days.
Initial download of the metrics may take a while.