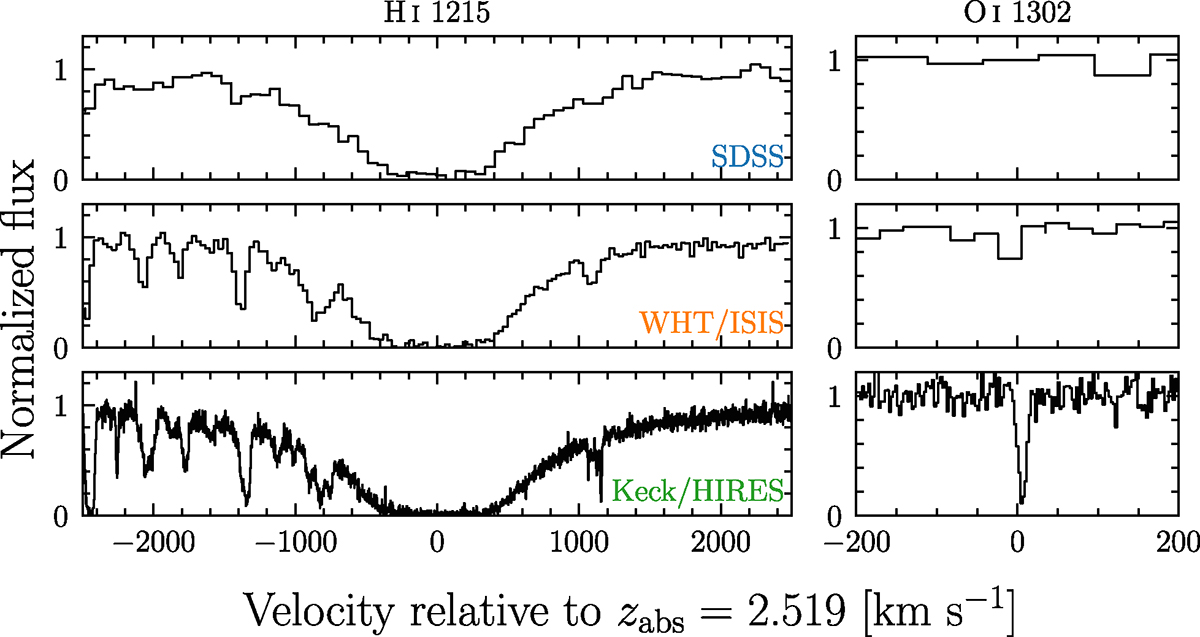
Fig. 2.
Download original image
Example of one of the absorption line systems studied in this work observed with increasingly higher resolution instruments. Each row shows the H I Lyα absorption and the region of spectrum where the strongest O I metal line should appear. The first row shows the archival SDSS data analyzed by Parks et al. (2018). The middle row shows the data taken in 2019 with WHT/ISIS. The final row shows the data taken with the high resolution echelle spectrograph Keck/HIRES.
Current usage metrics show cumulative count of Article Views (full-text article views including HTML views, PDF and ePub downloads, according to the available data) and Abstracts Views on Vision4Press platform.
Data correspond to usage on the plateform after 2015. The current usage metrics is available 48-96 hours after online publication and is updated daily on week days.
Initial download of the metrics may take a while.