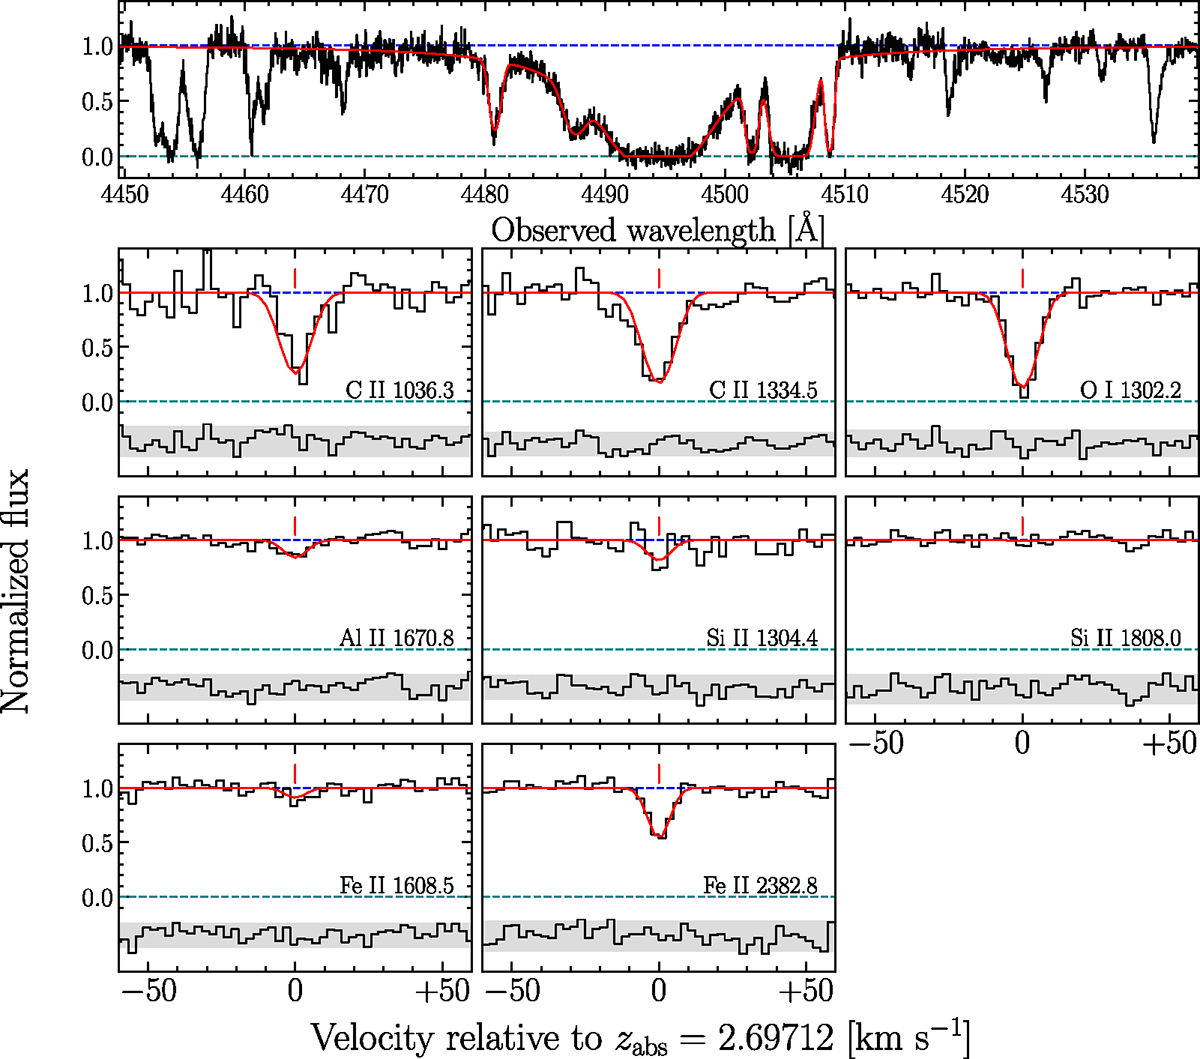
Fig. B.3.
Download original image
Same as Figure B.2 for the DLA at zabs = 2.51888 toward J1147+5034. Note the different y-axis scale of the fourth row. Note also the Si IIIλ1206 absorption feature in the top panel at ∼4246 Å. Also note that the Si IIλ1808 feature is not detected. Combined with the detection of stronger Si II lines, the coverage of this feature is useful to determine the total Si II column density.
Current usage metrics show cumulative count of Article Views (full-text article views including HTML views, PDF and ePub downloads, according to the available data) and Abstracts Views on Vision4Press platform.
Data correspond to usage on the plateform after 2015. The current usage metrics is available 48-96 hours after online publication and is updated daily on week days.
Initial download of the metrics may take a while.