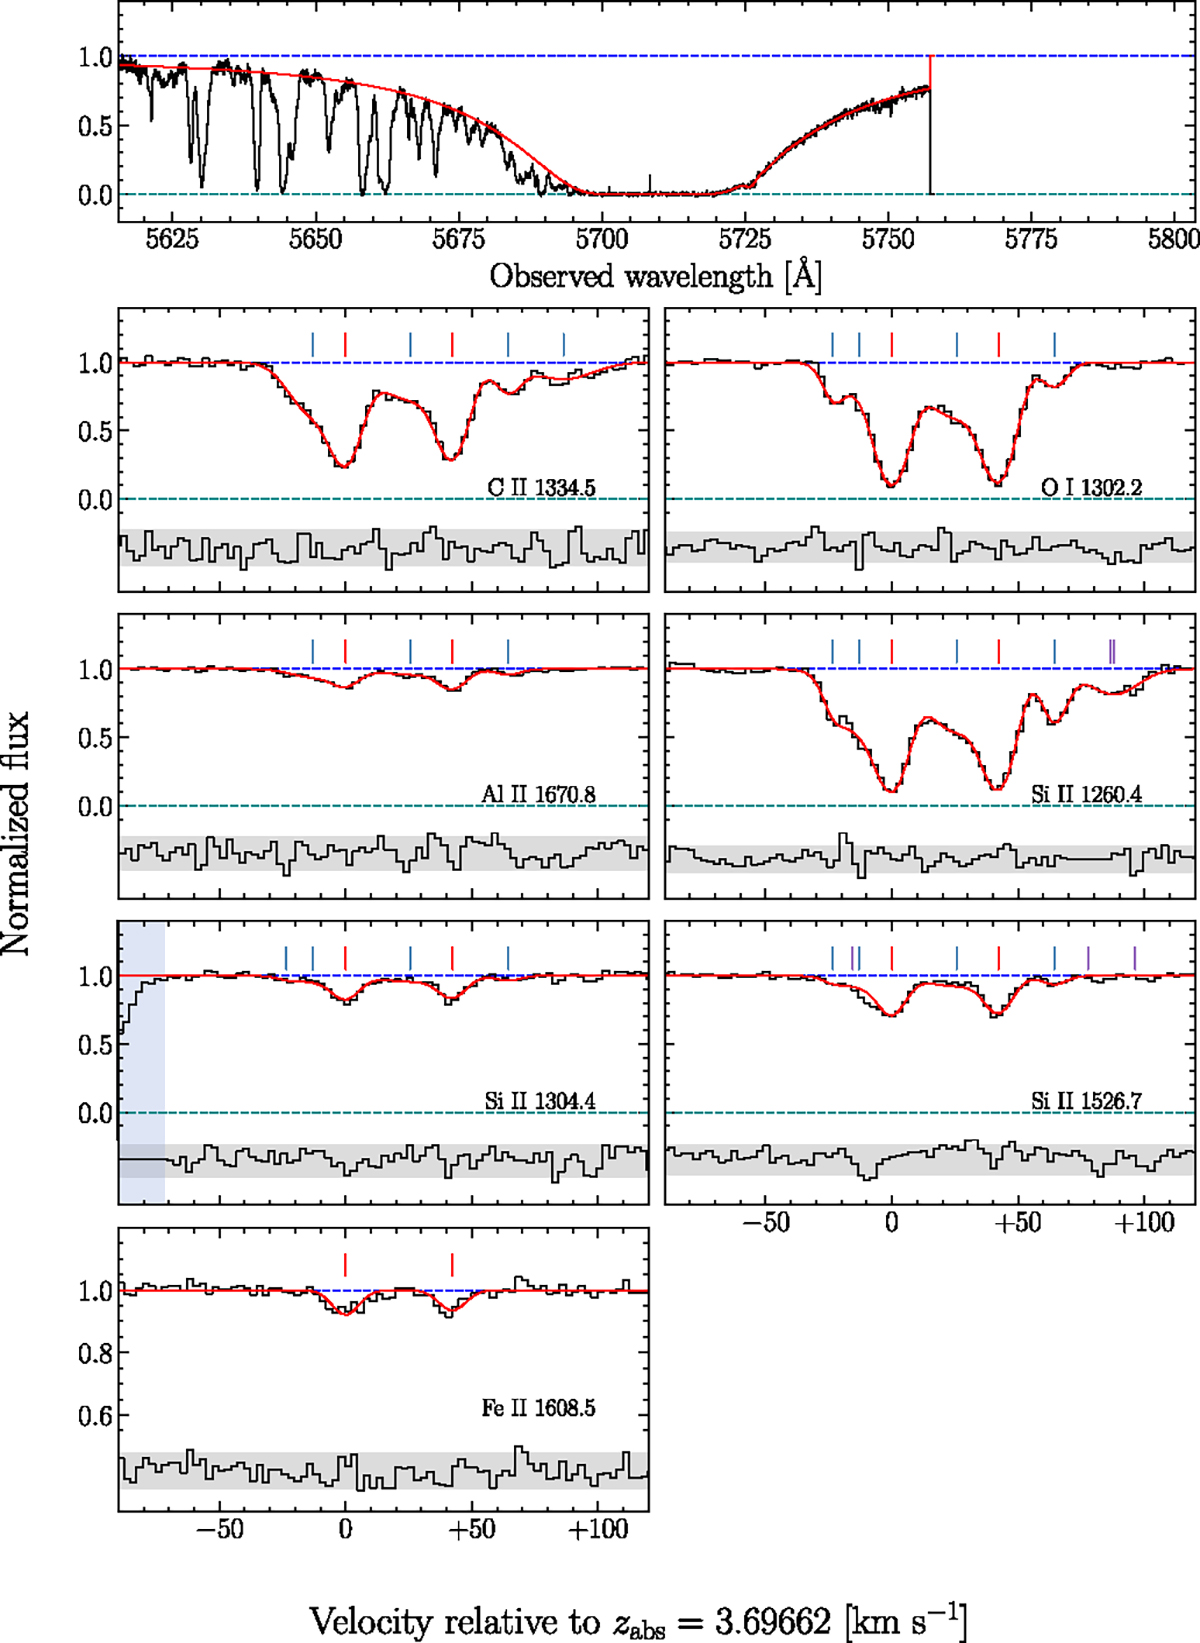
Fig. 1.
Download original image
Continuum normalized UVES data (black histograms) of the absorption features associated with the DLA at zabs = 3.69662 toward J0140−0819. The best-fitting model is shown with the red curves. The blue dashed line indicates the position of the continuum while the green dashed line indicates the zero-level. The ticks above the absorption features indicate the centre of the Voigt line profiles. The features of the strongest components are distinguished via red ticks while those of weaker components are shown in blue. These strongest components are also often associated with the predominantly neutral gas. The purple ticks indicate absorption features unrelated to the DLA. Below the zero-level, we show the residuals of this fit (black histogram) where the gray shaded band encompasses the 2σ deviates between the model and the data. The vertical blue shaded bands indicate the regions of the spectrum not included in the fit. Note that the full complement of available data were used in calculating the best-fit model, while we only show a selection of the data in this figure to showcase the model and the data. We also note that the y-axis scale is different in some panels to highlight the very weak absorption lines.
Current usage metrics show cumulative count of Article Views (full-text article views including HTML views, PDF and ePub downloads, according to the available data) and Abstracts Views on Vision4Press platform.
Data correspond to usage on the plateform after 2015. The current usage metrics is available 48-96 hours after online publication and is updated daily on week days.
Initial download of the metrics may take a while.