Fig. 7.
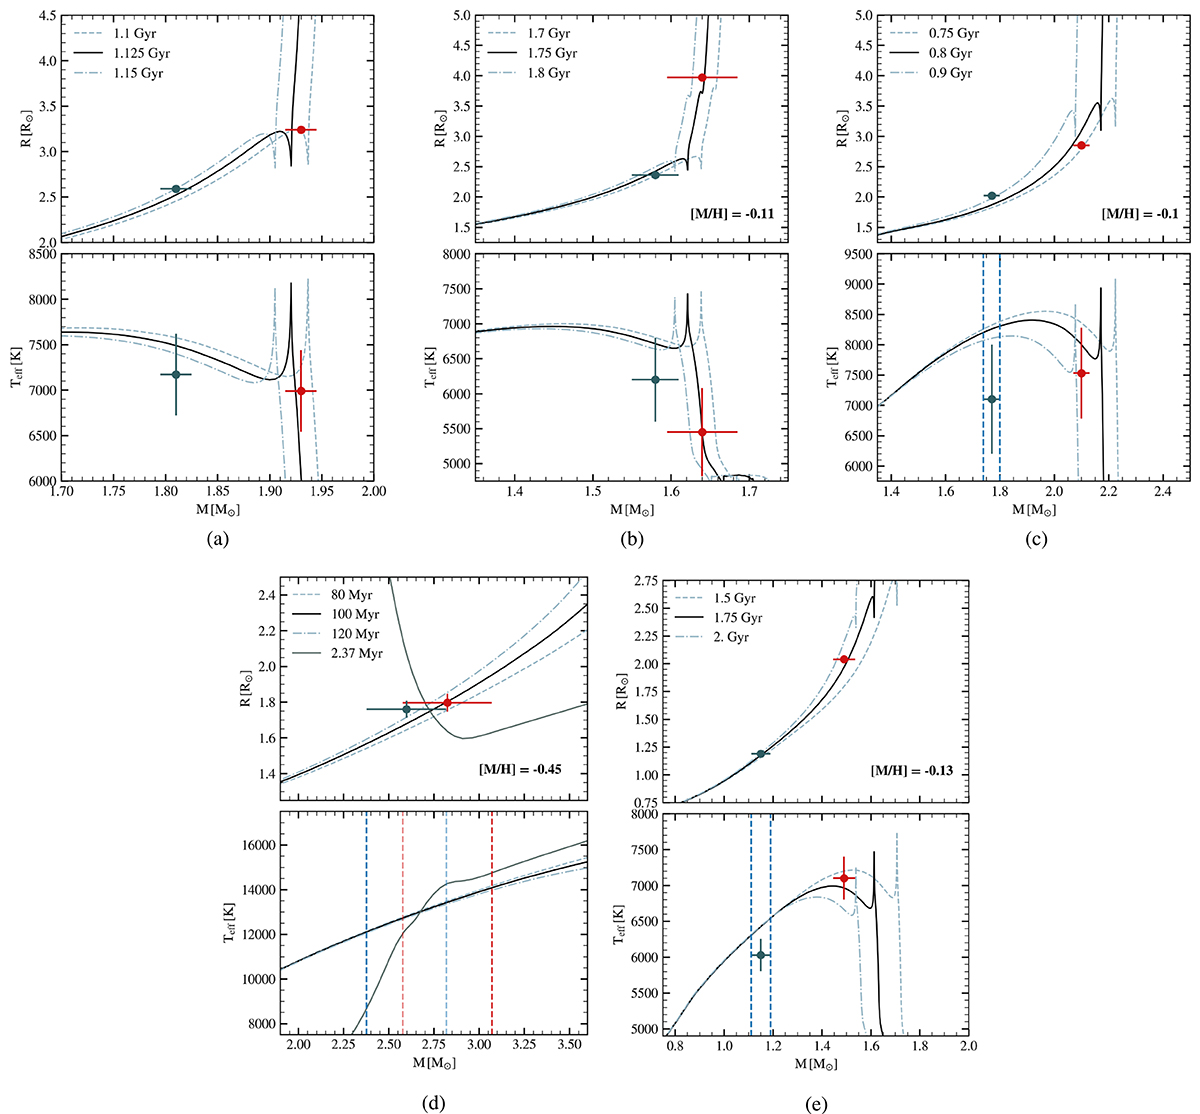
Download original image
Results from the isochrone fitting routine, indicating the positions of the stars in the mass-radius (top) and mass–(Teff) (bottom) diagrams. The black line indicates the best age estimate obtained for the set of input stellar parameters. The filled red and blue circles indicate the more and less massive components, respectively. In the case of TIC 165459595, the error bars represent the 2-σ region instead of 3-σ. (a) TIC 81702112. (b) TIC 189784898. (c) TIC 386622782. (d) TIC 165459595. (e) TIC 308953703.
Current usage metrics show cumulative count of Article Views (full-text article views including HTML views, PDF and ePub downloads, according to the available data) and Abstracts Views on Vision4Press platform.
Data correspond to usage on the plateform after 2015. The current usage metrics is available 48-96 hours after online publication and is updated daily on week days.
Initial download of the metrics may take a while.