Fig. 7
Download original image
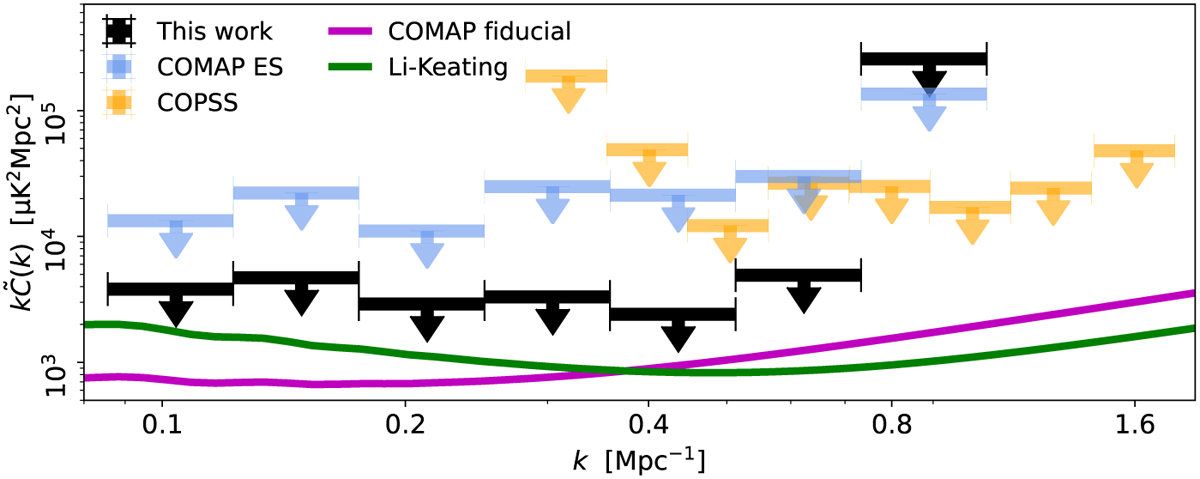
Comparison of upper 95% confidence limits (ULs) on the CO power spectrum as derived from the new COMAP dataset (black), the COMAP ES analysis (blue; Ihle et al. 2022), and from COPSS (orange; Keating et al. 2016). The corresponding data points for each bin are shown in Fig. 5, and all ULs are derived using a positivity prior. The theoretical model predictions indicated by green and purple lines are the same as in Fig. 5. We note that because the data point of the FGPXS and COMAP ES centered at k = 1.27 Mpc−1 in Figs. 4 and 5 have large uncertainties the corresponding 95% UL are outside y-range of the figure.
Current usage metrics show cumulative count of Article Views (full-text article views including HTML views, PDF and ePub downloads, according to the available data) and Abstracts Views on Vision4Press platform.
Data correspond to usage on the plateform after 2015. The current usage metrics is available 48-96 hours after online publication and is updated daily on week days.
Initial download of the metrics may take a while.